社区微信群开通啦,扫一扫抢先加入社区官方微信群

社区微信群
PProf是一个CPU分析器( cpu profiler), 它是gperftools工具的一个组件, 由Google工程师为分析多线程的程序所开发。
Go标准库中的pprof package通过HTTP的方式为pprof工具提供数据。
(译者注:不止这个包,runtime/pprof还可以为控制台程序或者测试程序产生pprof数据)
既然pprof数据通过HTTP提供,所以它需要在你的应用中运行一个web服务器。可以通过 import pprof的副作用(这里副作用 side-effect 是指引入这个包让其初始化,不是贬义词), 这个包就可以在缺省的web服务器中注册它的handler,并补需要其它额外的操作。
在Mac上安装工具:
1 2 |
$ brew install gperftools $ brew install graphviz |
pprof 文件分析
pprof 文件是二进制的,不是给人读的,需要翻译一下,而 golang 原生就给我们提供了分析工具,直接执行下面命令即可,会生成一张很直观的 svg 图片,直接用 chrome 就可以打开,当然也可以生成别的格式(pdf,png 都可以),可以用 go tool pprof -h 命令查看支持的输出类型
1.创建性能单元测试脚本
string_test.go
package awesomeProject

import (
   "strings"
   "testing"
)

func BenchmarkStringJoin1(b *testing.B) {
   b.ReportAllocs()
   input := []string{"Hello", "World"}
   for i := 0; i < b.N; i++ {
      result := strings.Join(input, " ")
      if result != "Hello World" {
         b.Error("Unexpected result: " + result)
      }
   }
}
2.执行性能测试benchmark,生成二进制out文件
go test -run string_test.go -bench=. -benchtime="3s" -cpuprofile profile_cpu.out
3.把二进制文件转换成图片或pdf
$ go tool pprof -pdf ./profile_cpu.out >cpu.pdf
对于一些服务来说,性能是极其重要的一环,事关系统的吞吐、访问的延迟,进而影响用户的体验。
写性能测试在Go语言中是很便捷的,go自带的标准工具链就有完善的支持,下面我们来从Go的内部和系统调用方面来详细剖析一下Benchmark这块儿。
Go做Benchmar只要在目录下创建一个_test.go后缀的文件,然后添加下面函数:
func BenchmarkStringJoin1(b *testing.B) {
    b.ReportAllocs()
    input := []string{"Hello", "World"}
    for i := 0; i < b.N; i++ {
        result := strings.Join(input, " ")
        if result != "Hello World" {
            b.Error("Unexpected result: " + result)
        }
    }
}
调用以下命令:
# go test -run=xxx -bench=. -benchtime="3s" -cpuprofile profile_cpu.out
该命令会跳过单元测试,执行所有benchmark,同时生成一个cpu性能描述文件.
这里有两个注意点:
BenchmarkStringJoin1-4 300000 4351 ns/op 32 B/op 2 allocs/op
-4表示4个CPU线程执行;300000表示总共执行了30万次;4531ns/op,表示每次执行耗时4531纳秒;32B/op表示每次执行分配了32字节内存;2 allocs/op表示每次执行分配了2次对象。
根据上面的信息,我们就能对热点路径进行内存对象分配的优化,例如针对上面的程序我们可以进行小小的优化:
func BenchmarkStringJoin2(b *testing.B) {
    b.ReportAllocs()
    input := []string{"Hello", "World"}
    join := func(strs []string, delim string) string {
        if len(strs) == 2 {
            return strs[0] + delim + strs[1];
        }
        return "";
    };
    for i := 0; i < b.N; i++ {
        result := join(input, " ")
        if result != "Hello World" {
            b.Error("Unexpected result: " + result)
        }
    }
}
新的Benchmark结果是:
BenchmarkStringJoin2-4 500000 2440 ns/op 16 B/op 1 allocs/op
可以看出来,在减少了内存分配后,性能提升了60%以上!
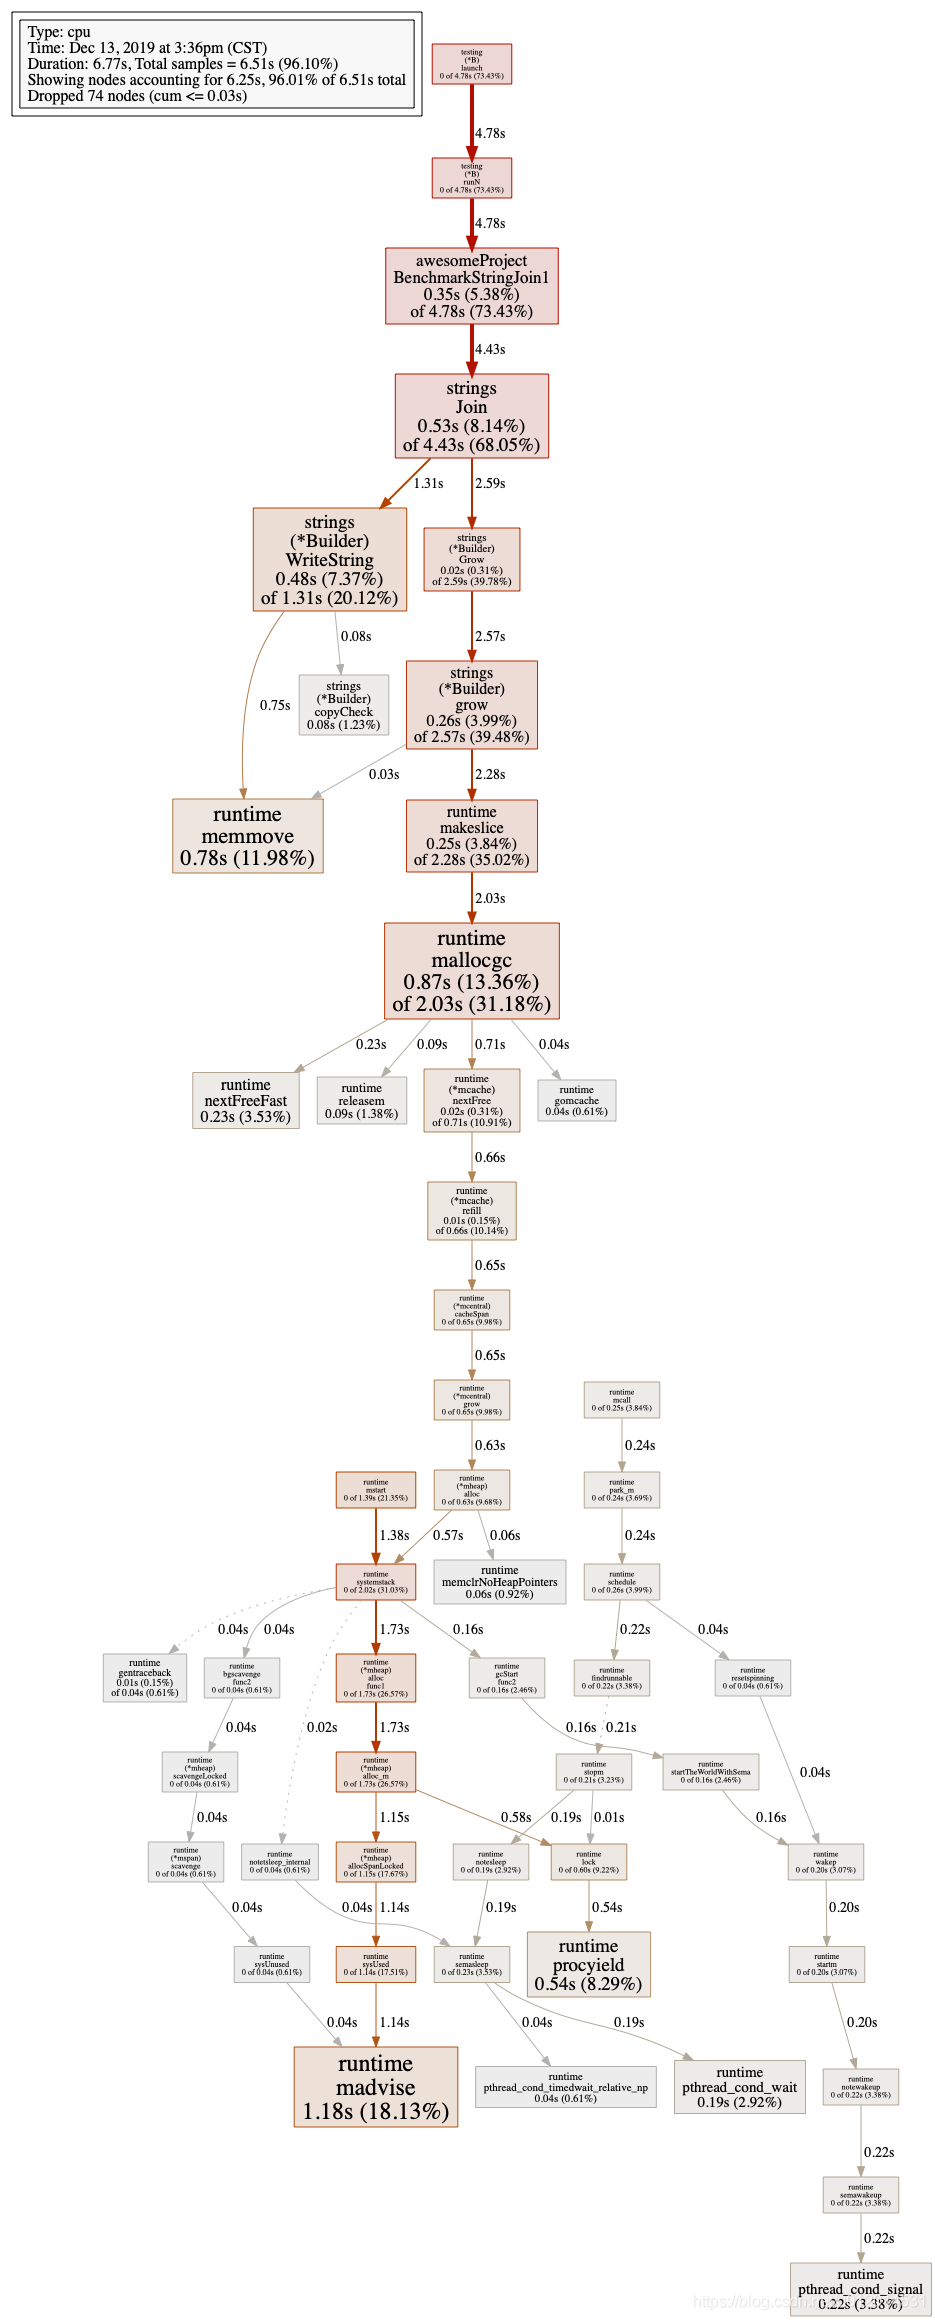
上一节的benchmark结果,我们只能看到函数的整体性能,但是如果该函数较为复杂呢?然后我们又想知道函数内部的耗时,这时就该Cpu Profile登场了。
Cpu profile是Go语言工具链中最闪耀的部分之一,掌握了它以及memory、block profile,那基本上就没有你发现不了的性能瓶颈了。
之前的benchmark同时还生成了一个profile_cpu.out文件,这里我们执行下面的命令:
# go tool pprof app.test profile_cpu.out
Entering interactive mode (type "help" for commands)
(pprof) top10
8220ms of 10360ms total (79.34%)
Dropped 63 nodes (cum <= 51.80ms)
Showing top 10 nodes out of 54 (cum >= 160ms)
      flat  flat%   sum%        cum   cum%
    2410ms 23.26% 23.26%     4960ms 47.88%  runtime.concatstrings
    2180ms 21.04% 44.31%     2680ms 25.87%  runtime.mallocgc
    1200ms 11.58% 55.89%     1200ms 11.58%  runtime.memmove
     530ms  5.12% 61.00%      530ms  5.12%  runtime.memeqbody
     530ms  5.12% 66.12%     2540ms 24.52%  runtime.rawstringtmp
     470ms  4.54% 70.66%     2420ms 23.36%  strings.Join
     390ms  3.76% 74.42%     2330ms 22.49%  app.BenchmarkStringJoin3B
     180ms  1.74% 76.16%     1970ms 19.02%  runtime.rawstring
     170ms  1.64% 77.80%     5130ms 49.52%  runtime.concatstring3
     160ms  1.54% 79.34%      160ms  1.54%  runtime.eqstring
上面仅仅展示部分函数的信息,并没有调用链路的性能分析,因此如果需要完整信息,我们要生成svg或者pdf图。
# go tool pprof -svg profile_cpu.out > profile_cpu.svg
# go tool pprof -pdf profile_cpu.out > profile_cpu.pdf
可以看到图里包含了多个benchmark的合集(之前的两段benmark函数都在同一个文件中),但是我们只关心性能最差的那个benchmark,因此需要过滤:
go test -run=xxx -bench=BenchmarkStringJoin2B$ -cpuprofile profile_2b.out
go test -run=xxx -bench=BenchmarkStringJoin2$ -cpuprofile profile_2.out
go tool pprof -svg profile_2b.out > profile_2b.svg
go tool pprof -svg profile_2.out > profile_2.svg
Go自带了测试框架和工具,在testing包中,以便完成单元测试(T类型)和性能测试(B类型)。
一般测试代码放在*_test.go文件中,与被测代码放于同一个包中。
测试函数名称格式是:Test[^a-z],即以Test开头,跟上非小写字母开头的字符串。每个测试函数都接受一个*testing.T类型参数,用于输出信息或中断测试。
测试方法有:
测试代码:
// filename: add_test.go

package test
import (
    "testing"
)

func Add(a, b int) int {
    return a + b
}

func TestAdd1(t *testing.T) {
    if Add(2, 3) != 5 {
         t.Error("result is wrong!")
    } else {
         t.Log("result is right")
    }
}

func TestAdd2(t *testing.T) {
    if Add(2, 3) != 6 {
         t.Fatal("result is wrong!")
    } else {
         t.Log("result is right")
    }
}
运行以下命令,自动搜集所有的测试文件(*_test.go),提取全部测试函数。
$ go test
输出:
--- FAIL: TestAdd2 (0.00s)
    add_test.go:20: result is wrong!
FAIL
exit status 1
FAIL    _/Users/golang_learning/testTB  0.006s
输出结果包括:出错的测试函数名称,执行时长和错误信息。
go test还有以下参数:
$ go test -v
输出:
=== RUN   TestAdd1
--- PASS: TestAdd1 (0.00s)
    add_test.go:14: result is right
=== RUN   TestAdd2
--- FAIL: TestAdd2 (0.00s)
    add_test.go:20: result is wrong!
FAIL
exit status 1
FAIL    _/Users/golang_learning/testTB  0.007s
$ go test -run TestAdd2
输出:
--- FAIL: TestAdd2 (0.00s)
    add_test.go:20: result is wrong!
FAIL
exit status 1
FAIL    _/Users/golang_learning/testTB  0.006s
性能测试函数以Benchmark 开头,参数类型是 *testing.B,可与Test函数放在同个文件中。默认情况下,go test不执行Benchmark测试,必须用“-bench <pattern>”指定性能测试函数。
测试代码:
// filename: add_test.go
package test
import (
    "testing"
)

func Add(a, b int) int {
    return a + b
}

func Benchmark(b *testing.B) {
    for i := 0; i < b.N; i++ { // b.N,测试循环次数
        Add(4, 5)
    }
}
执行命令测试:
$ go test -bench=.
输出:
goos: darwin
goarch: amd64
Benchmark-4     2000000000           0.35 ns/op
PASS
ok      _/Users/golang_learning/testTB  0.753s
B类型也有以下参数:
$ go test -v -bench=. -cpu=8 -benchtime="3s" -timeout="5s" -benchmem
输出:
goos: darwin
goarch: amd64
Benchmark-8     5000000000           0.34 ns/op        0 B/op          0 allocs/op
PASS
ok      _/Users/golang_learning/testTB  1.766s
go tools继承了pprof,以便进行性能测试并找出瓶颈。
测试数据文件生成有两种方法:命令行和代码
$ go test -bench=. -cpuprofile cpu.out
输出:
goos: darwin
goarch: amd64
Benchmark-4     2000000000           0.35 ns/op
PASS
ok      _/Users/golang_learning/testTB  0.911s
$ ls
输出:(上一条命令生成cpu.out和testTB.test)
add_test.go     cpu.out     testTB.test
$ go tool pprof -text mem.out
输出:
Main binary filename not available.
Type: inuse_space
Time: May 22, 2018 at 3:36pm (CST)
Showing nodes accounting for 1.16MB, 100% of 1.16MB total
      flat  flat%   sum%        cum   cum%
    1.16MB   100%   100%     1.16MB   100%  runtime/pprof.StartCPUProfile
         0     0%   100%     1.16MB   100%  main.main
         0     0%   100%     1.16MB   100%  runtime.main
$ go tool pprof testTB.test cpu.out
输出:
File: testTB.test
Type: cpu
Time: May 22, 2018 at 3:08pm (CST)
Duration: 906.10ms, Total samples = 670ms (73.94%)
Entering interactive mode (type "help" for commands, "o" for options)
(pprof) top
输出:
Showing nodes accounting for 670ms, 100% of 670ms total
      flat  flat%   sum%        cum   cum%
     670ms   100%   100%      670ms   100%  _/Users/golang_learning/testTB.Benchmark
         0     0%   100%      670ms   100%  testing.(*B).launch
         0     0%   100%      670ms   100%  testing.(*B).runN
(pprof) quit
以上性能指标含义:
pprof交互模式命令:
$ go tool pprof -svg cpu.out > cpu.svg
$ go tool pprof -pdf cpu.out > cpu.pdf
$ ls(以上命令生成cpu.pdf和cpu.svg文件)
add_test.go cpu.out cpu.pdf cpu.svg testTB.test用runtime/pprof包生成cpu和mem文件:
// filename: pprof.go
package main
import (
    "os"
    "runtime/pprof"
)

func main() {
    w, _ := os.Create("cpu.out")
    defer w.Close()
    pprof.StartCPUProfile(w)
    defer pprof.StopCPUProfile()

    w2, _ := os.Create("mem.out")
    defer w2.Close()
    defer pprof.WriteHeapProfile(w2)

    Sum(3, 5)

}

func Sum(a, b int) int {
    return a + b
}
编译并执行以上文件:
$ go build pprof.go
$ ./pprof
$ ls(./pprof命令生成cpu.out和mem.out文件)
cpu.out     mem.out     pprof       pprof.go
生成pdf文件:
$ go tool pprof -pdf cpu.out > cpu.pdf
$ go tool pprof -pdf mem.out > mem.pdf若是测量http server的性能,则需要使用net/http/pprof包。只需要在源文件中加入代码:
import (
    _ "net/http/pprof"
)
启动http server,然后在浏览器中访问链接:http://localhost:【port】/debug/pprof/
就能看到prof信息了:
image
若要生成CPU状态分析图,可使用以下命令:
$ go tool pprof http://localhost:port/debug/pprof/profile
就会进入30秒的profile收集时间,在这段事件内向服务器连续发送多次请求,尽量让cpu占用性能产生数据。
$ go tool pprof http://localhost:8080/debug/pprof/profile
输出:
Fetching profile over HTTP from http://localhost:8080/debug/pprof/profile
// 这里会阻塞30s收集profile,在这段时间应多发请求
Saved profile in /Users/pprof/pprof.samples.cpu.002.pb.gz
Type: cpu
Time: May 22, 2018 at 7:16pm (CST)
Duration: 30s, Total samples = 330ms ( 1.10%)
Entering interactive mode (type "help" for commands, "o" for options)
(pprof) top10
输出:(前10条信息)
Showing nodes accounting for 330ms, 100% of 330ms total
Showing top 10 nodes out of 39
      flat  flat%   sum%        cum   cum%
     100ms 30.30% 30.30%      100ms 30.30%  runtime.mach_semaphore_signal
      60ms 18.18% 48.48%       60ms 18.18%  runtime.mach_semaphore_timedwait
      60ms 18.18% 66.67%       60ms 18.18%  runtime.mach_semaphore_wait
      ... ...
(pprof) web
// 在浏览器中以svg文件的方式展示cpu占用图启动服务器,访问链接http://localhost:port/debug/pprof/heap,就会自动下载heap文件,调用以下命令,进入pprof交互模式:
$ go tool pprof heap
Main binary filename not available.
Type: inuse_space
Time: May 24, 2018 at 11:30pm (CST)
Entering interactive mode (type "help" for commands, "o" for options)
(pprof) top5
Showing nodes accounting for 62.02MB, 98.20% of 63.16MB total
Showing top 5 nodes out of 26
      flat  flat%   sum%        cum   cum%
   21.67MB 34.31% 34.31%    21.67MB 34.31%  bytes.makeSlice
   20.50MB 32.46% 66.77%    20.50MB 32.46%  reflect.unsafe_New
      15MB 23.75% 90.52%       15MB 23.75%  github.com/golang/protobuf/proto.(*word32Slice).Append
    2.85MB  4.51% 95.03%     2.85MB  4.51%  github.com/golang/protobuf/proto.(*structPointerSlice).Append
       2MB  3.17% 98.20%        2MB  3.17%  github.com/golang/protobuf/proto.word32_Set
(pprof) web
常用命令
go test -run main2_test.go -bench=. benchtime="3s" -test.cpuprofile cpu.out
-memprofile string
write memory profile to this file
-test.bench regexp
run only benchmarks matching regexp
-test.benchmem
print memory allocations for benchmarks
-test.benchtime d
run each benchmark for duration d (default 1s)
-test.blockprofile file
write a goroutine blocking profile to file
-test.blockprofilerate rate
set blocking profile rate (see runtime.SetBlockProfileRate) (default 1)
-test.count n
run tests and benchmarks n times (default 1)
-test.coverprofile file
write a coverage profile to file
-test.cpu list
comma-separated list of cpu counts to run each test with
-test.cpuprofile file
write a cpu profile to file
-test.failfast
do not start new tests after the first test failure
-test.list regexp
list tests, examples, and benchmarks matching regexp then exit
-test.memprofile file
write an allocation profile to file
-test.memprofilerate rate
set memory allocation profiling rate (see runtime.MemProfileRate)
-test.mutexprofile string
write a mutex contention profile to the named file after execution
-test.mutexprofilefraction int
if >= 0, calls runtime.SetMutexProfileFraction() (default 1)
-test.outputdir dir
write profiles to dir
-test.parallel n
run at most n tests in parallel (default 12)
-test.run regexp
run only tests and examples matching regexp
-test.short
run smaller test suite to save time
-test.testlogfile file
write test action log to file (for use only by cmd/go)
-test.timeout d
panic test binary after duration d (default 0, timeout disabled)
-test.trace file
write an execution trace to file
-test.v
verbose: print additional output
如果觉得我的文章对您有用,请随意打赏。你的支持将鼓励我继续创作!
