社区微信群开通啦,扫一扫抢先加入社区官方微信群

社区微信群
上一篇主要介绍prometheus基础告警相关,本篇再进行扩展,加入mysql监控,整理出一些监控告警表达式及配置文件,以及部署prometheus 2.0版之后支持的联邦job,多prometheus分支数据聚合,在多集群环境中很适用。
在公司的环境中,大部分的DB已迁移至K8S内运行,因此再以常见的节点二进制安装部署mysqld-exporter的方式不再适用。在本地k8s环境中,采取单pod包含多容器镜像的方式,为原本的DB pod实例多注入一个mysql-exporter的方式,对两者进行整合为一体部署,类似此前文章里istio的注入。
注入后的deployment文件的spec.template.spec.containers变更如下:
    spec:
      containers:
      - name: mydbtm
        env:
        - name: DB_NAME
          value: mydbtm
        image: registry.xxx.com:5000/mysql:56v6
        imagePullPolicy: Always
        livenessProbe:
          failureThreshold: 3
          initialDelaySeconds: 30
          periodSeconds: 10
          successThreshold: 1
          tcpSocket:
            port: 3306
          timeoutSeconds: 30
        ports:
        - containerPort: 3306
          protocol: TCP
        resources:
          limits:
            memory: 4Gi
          requests:
            memory: 512Mi
        terminationMessagePath: /dev/termination-log
        volumeMounts:
        - mountPath: /var/lib/mysql
          name: datadir

      - name: mysql-exporter
        env:
        - name: DATA_SOURCE_NAME
          value: $username:$passwrod@(127.0.0.1:3306)/
        image: prom/mysqld-exporter
        imagePullPolicy: Always
        name: mysql-exporter
        ports:
        - containerPort: 9104
          protocol: TCP
额外多增加一个mysql-exporter的容器,并提供环境变量DATA_SOURCE_NAME,注意,pod运行起来后,需要保证DATA_SOURCE_NAME的账号有数据库的读写权限。否则权限问题会导致无法获取数据。
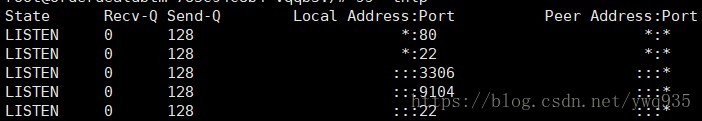
进入pod查看端口3306/9104是否监听正常:
部署完mysql实例以及mysqld-exporter后,需要在prometheus的配置文件中增加相应的job。因为容器内POD IP是可变的,为了保证连接的持续可靠性,这里为该deployment创建了一个svc,通过svc的cluster IP与prometheus进行绑定,这样就基本不用担心POD IP变化了。
首先创建svc,捆绑2个服务端口:
apiVersion: v1
kind: Service
metadata:
  labels:
    app: mydbtm
  name: mydbtm
  namespace: default
spec:
  ports:
  - port: 3306
    protocol: TCP
    targetPort: 3306
    name: mysql
  - port: 9104
    protocol: TCP
    targetPort: 9104
    name: mysql-exporter
  selector:
    app: mydbtm
  sessionAffinity: None
  type: ClusterIP
kubectl get svc 获取刚创建的svc 的cluster IP,绑定至prometheus的confimap:
在prometheus-configmap.yaml下添加一个job,targets对应的列表内填写刚获取到的cluster IP和9104端口,后续增加实例可直接在列表中添加元素:
    - job_name: 'mysql performance'
      scrape_interval: 1m
      static_configs:
        - targets:
           ['10.102.20.179:9104']
      params:
        collect[]:
          - global_status
          - perf_schema.tableiowaits
          - perf_schema.indexiowaits
          - perf_schema.tablelocks
更新配置文件后滚动更新pod加载配置文件:
kubectl patch deployment prometheus --patch '{"spec": {"template": {"metadata": {"annotations": {"update-time": "2018-06-25 17:50" }}}}}' -n kube-system
查看prometheus的target,可以看到mysql-exporter已经up了,如果有异常,检查pod日志:
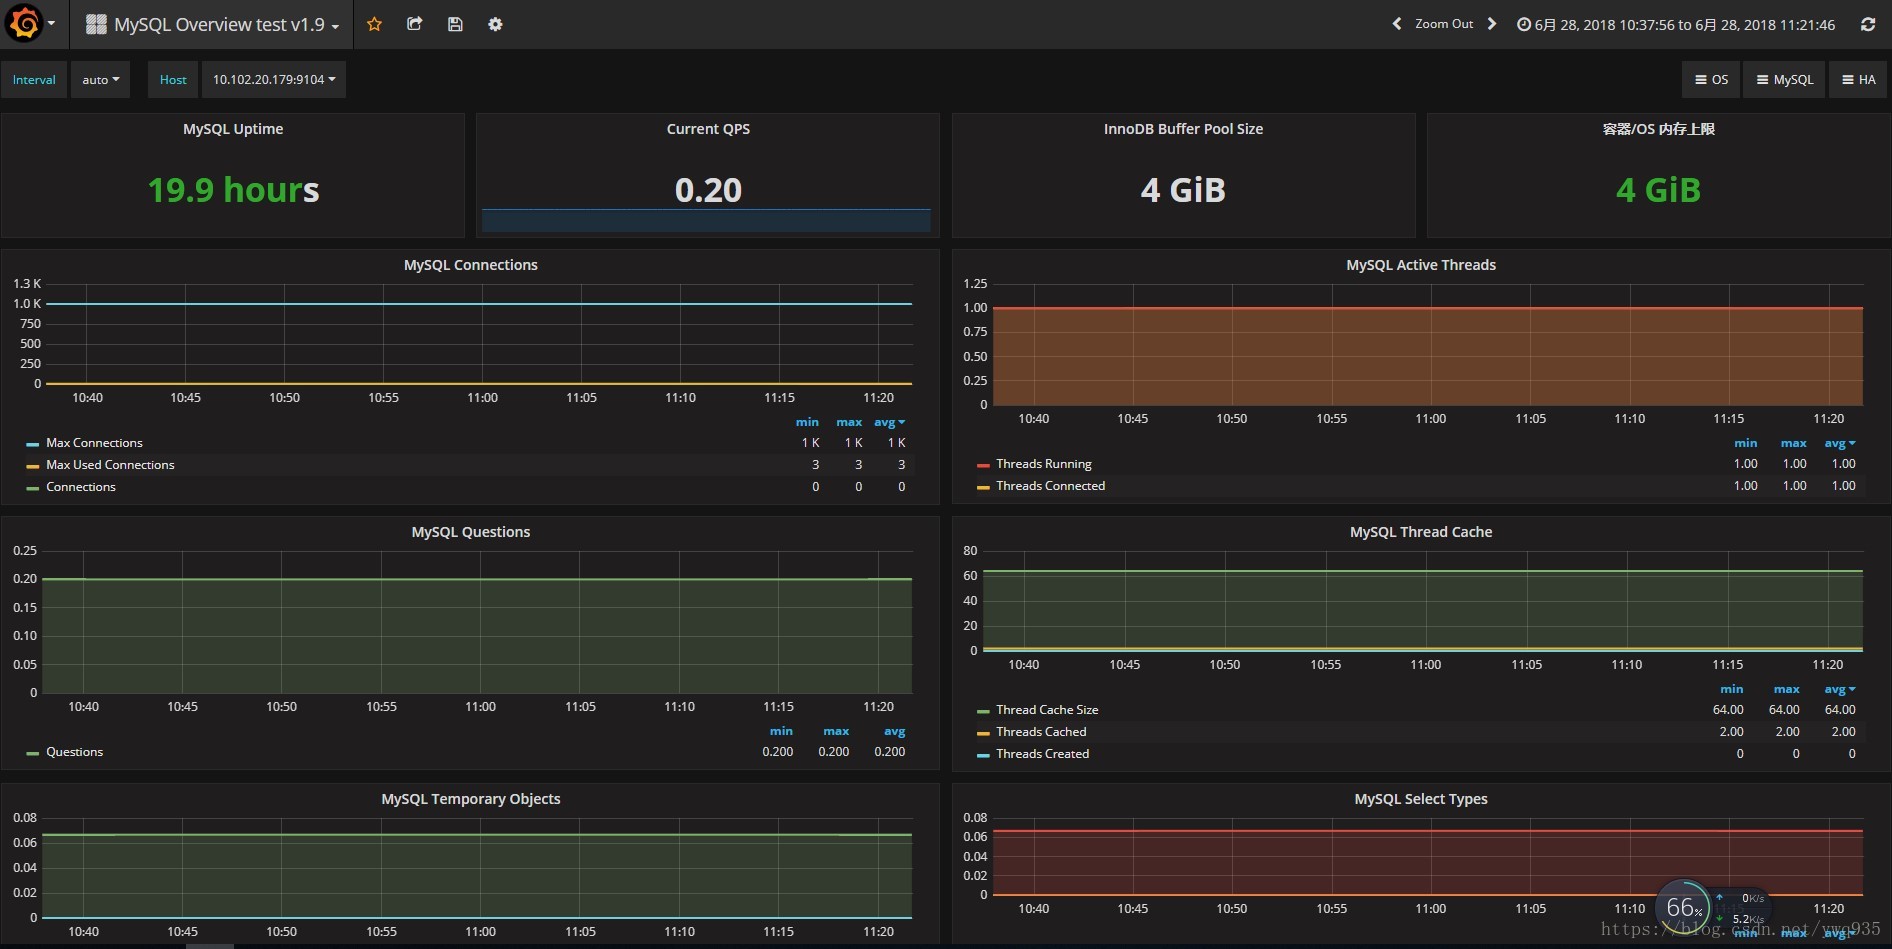
打开grafana查看mysql模板里的监控图:
在k8s环境中,部署的应用可能是海量的,如果像上方一样手动在static_configs.targets中增加对象,然后再触发prometheus实例的更新,未免显得太过麻烦和笨重,好在promethues提供SD(service discovery)功能,支持基于k8s的自动发现服务,可以自动发现k8s的node/service/pod/endpoints/ingress这些类型的资源。
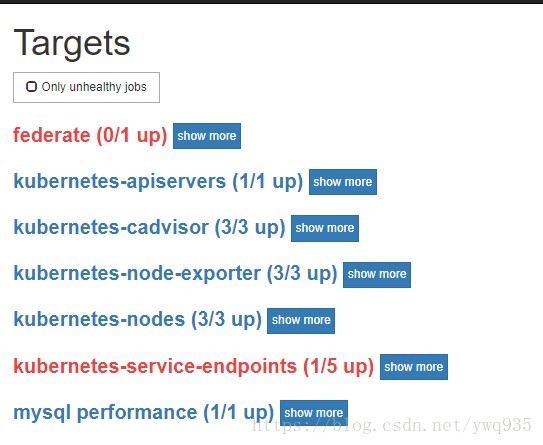
其实在第一部分部署时,已经指定了kubernetes-service的target job,但是可以看到在web /target 路径页面上没有看到任何相关的job,连kubernetes-service的标题都没有:
在查阅了官方文档后,发现其中的说明并不详尽,没有具体的配置样例,网上关于此类场景的文章也没有找到,为此,特意去github上提交了issue向项目member请教,最后得知了不生效的原因为标签不匹配。
github issue链接:https://github.com/prometheus/prometheus/issues/4326
官方文档配置说明链接:prometheus配置
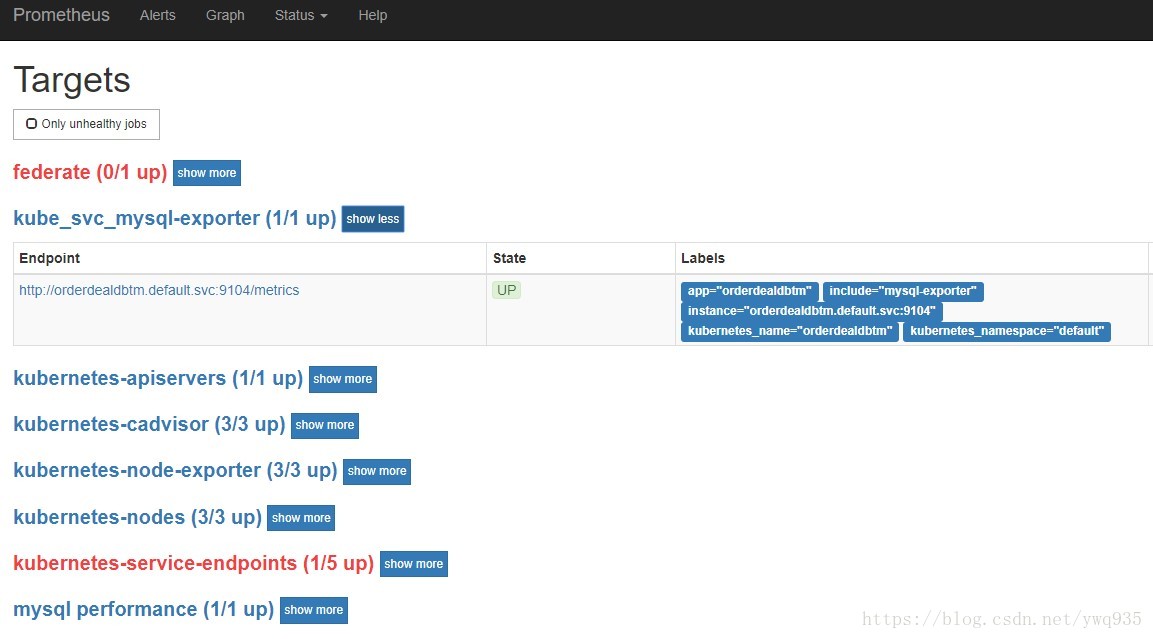
作出如下修改后,配置生效,web上可见:
1.job:
    - job_name: 'kube_svc_mysql-exporter'
      kubernetes_sd_configs:
      - role: service
      metrics_path: /metrics
      relabel_configs:
      - source_labels: [__meta_kubernetes_service_annotation_prometheus_io_probe]
        action: keep
        regex: true
        # 匹配svc.metadata.annotation字段包含key/value(prometheus.io/probe: "true")
      - source_labels: [__meta_kubernetes_service_port_name]
        action: keep
        regex: "mysql-exporter"
        # 匹配svc.spec.ports.name 是否包含mysql-exporter
      - action: labelmap
        regex: __meta_kubernetes_service_label_(.+)
      - source_labels: [__meta_kubernetes_namespace]
        target_label: kubernetes_namespace
      - source_labels: [__meta_kubernetes_service_name]
        target_label: kubernetes_name
svc样例:
apiVersion: v1
kind: Service
metadata:
  labels:
    app: testdbtm
  annotations:
    # 必须包含这个kv以匹配上方job规则
    prometheus.io/probe: true
  name: testdbtm
  namespace: default
spec:
  ports:
  - port: 3306
    protocol: TCP
    targetPort: 3306
    name: mysql
  - port: 9104
    protocol: TCP
    targetPort: 9104
    # 必须包含这个name以匹配job规则.(annotations和这里二选一即可,不需要全部匹配)
    name: mysql-exporter
  selector:
    app: orderdealdbtm
  sessionAffinity: None
  type: ClusterIP
更新configmap以及prometheus实例后,即可在web /targets页面中查看到自动发现的包含mysql-exporter的svc,通过其集群FQDN域名+9104端口获取mysql-exporter metrics,实现自动发现。其他的各种应用,也可以类似定制。
经过这几天的验证,整理了一些基础的监控项表达式,根据exporter进行了分类,当然这还不够,需要根据环境持续补充,调整.注意,metric的名称在不同的版本有些许不同,我们的环境中有两套prometheus,其中一套对应的exporter版本较低,注意点已注释出:
targets:
	cadvisor:
		#包含pod(container)相关指标
		url: http://$NODE_IP:10255

		metric expr:
		  ### 容器内存使用率超过limit值80%,部分pod没有limit限制,所以值为+Inf,需要排除
		  - container_memory_usage_bytes{kubernetes_container_name!=""} / container_spec_memory_limit_bytes{kubernetes_container_name!=""}  *100 != +Inf > 80 #低版本
          - container_memory_usage_bytes{container_name!=""} / container_spec_memory_limit_bytes{container_name!=""}  *100 != +Inf > 80  #新版本

		  ### 计算pod的内存使用情况,单位为MB,可以按需设定阈值,有两个表达式都可以实现,感觉第一个结果更清晰。
		  - sum (container_memory_working_set_bytes{image!="",name=~"^k8s_.*"}) by (pod_name) /1024 /1024  #低版本pod_name改成kubernetes_pod_name
		  - sort_desc(sum(container_memory_usage_bytes{image!=""}) by (io_kubernetes_container_name, image)) / 1024 / 1024   #通用


		  ### 根据相同的pod_name来计算过去一分钟内pod 的 cpu使用率,metric名称版本不同也有些不一样:
		  - sum by (pod_name)( rate(container_cpu_usage_seconds_total{image!=""}[1m] ) ) * 100 > 70  #高版本
		  - sum by (kubernetes_pod_name)( rate(container_cpu_usage_seconds_total{image!=""}[1m] ) ) * 100 > 70  #低版本


		  ### 计算pod的网络IO情况,单位为Mbps
			# rx方向
		  - sort_desc(sum by (kubernetes_pod_name) (rate (container_network_receive_bytes_total{name!=""}[1m]) )) /1024 /1024 /60 * 8 > 100 #低版本
		  - sort_desc(sum by (pod_name) (rate (container_network_receive_bytes_total{name!=""}[1m]) )) /1024 /1024 /60 *8  > 100 #高版本
		    # tx方向
		  - sort_desc(sum by (kubernetes_pod_name) (rate (container_network_transmit_bytes_total{name!=""}[1m]) )) /1024 /1024 /60 * 8 > 100 #低版本
		  - sort_desc(sum by (pod_name) (rate (container_network_transmit_bytes_total{name!=""}[1m]) )) /1024 /1024 /60 *8  > 100 #高版本


	node-exporter:
	    ### 主要包含node相关的指标
		# url: http://$NODE_IP:31672/metrics

		metric expr:
		  ### node磁盘使用率
		  -	(node_filesystem_size_bytes - node_filesystem_free_bytes) / node_filesystem_size_bytes * 100 > 80

		  ### node内存使用率
		  -	(node_memory_MemTotal_bytes - node_memory_MemFree_bytes) / node_memory_MemTotal_bytes  * 100 > 80


		  ### 计算node cpu使用率,关于此项计算,参考了许多个模板的表达式,但感觉都不太精确,下面两个是模板里找到的:
		  	# 这些模板里计算node cpu使用率的表达式,都是拿容器cpu使用情况除以节点cpu总数,这样计算出来的结果感觉有些偏差,因为node本身
			# 还有一些额外开销,虽然在大集群中,node本身的开销相比较于这么多容器开销来说占比较小,但是还是不可忽视:
		  - sum(sum by (io_kubernetes_container_name)( rate(container_cpu_usage_seconds_total{image!=""}[1m] ) )) / count(node_cpu{mode="system"}) * 100
		  -	sum (rate (container_cpu_usage_seconds_total{id="/"}[1m])) / sum (machine_cpu_cores) * 100

		  	# 因此经过对集群cpu使用率的实际观察,我觉得下面这个表达式计算出的数值更为准确:
		  - (sum(rate(node_cpu_seconds_total[1m])) - sum(rate(node_cpu_seconds_total{mode="idle"}[1m]))) / sum(rate(node_cpu_seconds_total[1m]))  * 100 > 80

		    # 在老版本的exporter中`node_cpu_seconds_total`这个metric值叫`node_cpu`,因此老版本使用这个表达式:
		  - (sum(rate(node_cpu[1m])) - sum(rate(node_cpu{mode="idle"}[1m]))) / sum(rate(node_cpu[1m]))  * 100 > 80


	mysql-exporter:
		### 主要包含mysql相关指标
		## url: http://$Mysql_IP:9104/metrics
			# innodb各类型缓存缓存大小:
			  - InnoDB Buffer Pool Data size : mysql_global_status_innodb_page_size * on (instance) mysql_global_status_buffer_pool_pages{state="data"}
			  - InnoDB Log Buffer Size: mysql_global_variables_innodb_log_buffer_size
			  - InnoDB Additional Memory Pool Size: mysql_global_variables_innodb_additional_mem_pool_size
			  - InnoDB Dictionary Size: mysql_global_status_innodb_mem_dictionary
			  - Key Buffer Size: mysql_global_variables_key_buffer_size
			  - Query Cache Size: mysql_global_variables_query_cache_size
			  - Adaptive Hash Index Size: mysql_global_status_innodb_mem_adaptive_hash


		metric expr:
		  # 实例启动时间,单位s,三分钟内有重启记录则告警
		  - mysql_global_status_uptime < 180

		  # 每秒查询次数指标
		  - rate(mysql_global_status_questions[5m]) > 500

		  # 连接数指标
		  - rate(mysql_global_status_connections[5m]) > 200

		  # mysql接收速率,单位Mbps
		  - rate(mysql_global_status_bytes_received[3m]) * 1024 * 1024 * 8   > 50

		  # mysql传输速率,单位Mbps
		  - rate(mysql_global_status_bytes_sent[3m]) * 1024 * 1024 * 8   > 100

		  # 慢查询
		  - rate(mysql_global_status_slow_queries[30m]) > 3

		  # 死锁
		  - rate(mysql_global_status_innodb_deadlocks[3m]) > 1

		  # 活跃线程小于30%
		  - mysql_global_status_threads_running / mysql_global_status_threads_connected * 100 < 30


		  # innodb缓存占用缓存池大小超过80%
		  - (mysql_global_status_innodb_page_size * on (instance) mysql_global_status_buffer_pool_pages{state="data"} +  on (instance) mysql_global_variables_innodb_log_buffer_size +  on (instance) mysql_global_variables_innodb_additional_mem_pool_size + on (instance)  mysql_global_status_innodb_mem_dictionary + on (instance)  mysql_global_variables_key_buffer_size + on (instance)  mysql_global_variables_query_cache_size + on (instance) mysql_global_status_innodb_mem_adaptive_hash )  / on (instance) mysql_global_variables_innodb_buffer_pool_size * 100 > 80
根据上方的监控项expr,整理出如下rules规则模板:
  rules.yml: |
    groups:
    - name: alert-rule
      rules:
      ### Node监控
      - alert: NodeFilesystemUsage-high
        expr: (node_filesystem_size_bytes - node_filesystem_free_bytes) / node_filesystem_size_bytes * 100 > 80
        for: 2m
        labels:
          team: node
          severity: warning
        annotations:
          summary: "{{$labels.instance}}: High Node Filesystem usage detected"
          description: "{{$labels.instance}}: Node Filesystem usage is above 80% ,(current value is: {{ $value }})"
      - alert: NodeMemoryUsage
        expr: (node_memory_MemTotal_bytes - node_memory_MemFree_bytes) / node_memory_MemTotal_bytes  * 100 > 80
        for: 2m
        labels:
          severity: warning
        annotations:
          summary: "{{$labels.instance}}: High Node Memory usage detected"
          description: "{{$labels.instance}}: Node Memory usage is above 80% ,(current value is: {{ $value }})"
      - alert: NodeCPUUsage
        expr: (sum(rate(node_cpu_seconds_total[1m])) - sum(rate(node_cpu_seconds_total{mode="idle"}[1m]))) / sum(rate(node_cpu_seconds_total[1m]))  * 100 > 80
        for: 2m
        labels:
          severity: warning
        annotations:
          summary: "{{$labels.instance}}: Node High CPU usage detected"
          description: "{{$labels.instance}}: Node CPU usage is above 80% ,(current value is: {{ $value }})"
      - alert: NodeCPUUsage_
        expr: (sum(rate(node_cpu[1m])) - sum(rate(node_cpu{mode="idle"}[1m]))) / sum(rate(node_cpu[1m]))  * 100 > 80
        for: 2m
        labels:
          severity: warning
        annotations:
          summary: "{{$labels.instance}}: Node High CPU usage detected"
          description: "{{$labels.instance}}: Node CPU usage is above 80% ,(current value is: {{ $value }})"
       ### Pod监控
      - alert: PodMemUsage
        expr: container_memory_usage_bytes{container_name!=""} / container_spec_memory_limit_bytes{container_name!=""}  *100 != +Inf > 80
        for: 2m
        labels:
          severity: warning
        annotations:
          summary: "{{$labels.instance}}: Pod High Mem usage detected"
          description: "{{$labels.instance}}: Pod Mem is above 80% ,(current value is: {{ $value }})"
      - alert: PodMemUsage_
        expr: container_memory_usage_bytes{kubernetes_container_name!=""} / container_spec_memory_limit_bytes{kubernetes_container_name!=""}  *100 != +Inf > 90
        for: 2m
        labels:
          severity: warning
        annotations:
          summary: "{{$labels.instance}}: Pod High Mem usage detected"
          description: "{{$labels.instance}}: Pod Mem is above 80% ,(current value is: {{ $value }})"
      - alert: PodCpuUsage
        expr: sum by (pod_name)( rate(container_cpu_usage_seconds_total{image!=""}[1m] ) ) * 100 > 70
        for: 2m
        labels:
          severity: warning
        annotations:
          summary: "{{$labels.instance}}: Pod High CPU usage detected"
          description: "{{$labels.instance}}: Pod CPU is above 80% ,(current value is: {{ $value }})"
      - alert: PodCpuUsage_
        expr: sum by (kubernetes_pod_name)( rate(container_cpu_usage_seconds_total{image!=""}[1m] ) ) * 100 > 70
        for: 2m
        labels:
          severity: warning
        annotations:
          summary: "{{$labels.instance}}: Pod High CPU usage detected"
          description: "{{$labels.instance}}: Pod CPU is above 80% ,(current value is: {{ $value }})"
      - alert: NetI/O_RX
        expr: sort_desc(sum by (kubernetes_pod_name) (rate (container_network_receive_bytes_total{name!=""}[1m]) )) /1024 /1024 /60 * 8 > 500
        for: 2m
        labels:
          severity: warning
        annotations:
          summary: "{{$labels.instance}}: Pod High NetI/O_RX detected"
          description: "{{$labels.instance}}: Pod NetI/O_RX is more than 500Mbps ,(current value is: {{ $value }})"
      - alert: NetI/O_RX_
        expr: sort_desc(sum by (pod_name) (rate (container_network_receive_bytes_total{name!=""}[1m]) )) /1024 /1024 /60 *8  > 500
        for: 2m
        labels:
          severity: warning
        annotations:
          summary: "{{$labels.instance}}: Pod High NetI/O_RX detected"
          description: "{{$labels.instance}}: Pod NetI/O_RX is more than 500Mbps ,(current value is: {{ $value }})"
      - alert: NetI/O_TX
        expr: sort_desc(sum by (kubernetes_pod_name) (rate (container_network_transmit_bytes_total{name!=""}[1m]) )) /1024 /1024 /60 * 8 > 500
        for: 2m
        labels:
          severity: warning
        annotations:
          summary: "{{$labels.instance}}: Pod High NetI/O_TX detected"
          description: "{{$labels.instance}}: Pod NetI/O_TX is more than 100Mbps ,(current value is: {{ $value }})"
      - alert: NetI/O_TX_
        expr: sort_desc(sum by (pod_name) (rate (container_network_transmit_bytes_total{name!=""}[1m]) )) /1024 /1024 /60 *8 > 500
        for: 2m
        labels:
          severity: warning
        annotations:
          summary: "{{$labels.instance}}: Pod High NetI/O_TX detected"
          description: "{{$labels.instance}}: Pod NetI/O_TX is more than 100Mbps ,(current value is: {{ $value }})"
       ### Mysql监控
      - alert: Mysql_Instance_Reboot
        expr: mysql_global_status_uptime < 180
        for: 2m
        labels:
          severity: warning
        annotations:
          summary: "{{$labels.instance}}: Mysql_Instance_Reboot detected"
          description: "{{$labels.instance}}: Mysql_Instance_Reboot in 3 minute (up to now is: {{ $value }} seconds"
      - alert: Mysql_High_QPS
        expr: rate(mysql_global_status_questions[5m]) > 500
        for: 2m
        labels:
          severity: warning
        annotations:
          summary: "{{$labels.instance}}: Mysql_High_QPS detected"
          description: "{{$labels.instance}}: Mysql opreation is more than 500 per second ,(current value is: {{ $value }})"
      - alert: Mysql_Too_Many_Connections
        expr: rate(mysql_global_status_connections[5m]) > 100
        for: 2m
        labels:
          severity: warning
        annotations:
          summary: "{{$labels.instance}}: Mysql Too Many Connections detected"
          description: "{{$labels.instance}}: Mysql Connections is more than 100 per second ,(current value is: {{ $value }})"
      - alert: Mysql_High_Recv_Rate
        expr: rate(mysql_global_status_bytes_received[3m]) * 1024 * 1024 * 8   > 100
        for: 2m
        labels:
          severity: warning
        annotations:
          summary: "{{$labels.instance}}: Mysql_High_Recv_Rate detected"
          description: "{{$labels.instance}}: Mysql_Receive_Rate is more than 100Mbps ,(current value is: {{ $value }})"
      - alert: Mysql_High_Send_Rate
        expr: rate(mysql_global_status_bytes_sent[3m]) * 1024 * 1024 * 8   > 100
        for: 2m
        labels:
          severity: warning
        annotations:
          summary: "{{$labels.instance}}: Mysql_High_Send_Rate detected"
          description: "{{$labels.instance}}: Mysql data Send Rate is more than 100Mbps ,(current value is: {{ $value }})"
      - alert: Mysql_Too_Many_Slow_Query
        expr: rate(mysql_global_status_slow_queries[30m]) > 3
        for: 2m
        labels:
          severity: warning
        annotations:
          summary: "{{$labels.instance}}: Mysql_Too_Many_Slow_Query detected"
          description: "{{$labels.instance}}: Mysql current Slow_Query Sql is more than 3 ,(current value is: {{ $value }})"
      - alert: Mysql_Deadlock
        expr: mysql_global_status_innodb_deadlocks > 0
        for: 2m
        labels:
          severity: warning
        annotations:
          summary: "{{$labels.instance}}: Mysql_Deadlock detected"
          description: "{{$labels.instance}}: Mysql Deadlock was found ,(current value is: {{ $value }})"
      - alert: Mysql_Too_Many_sleep_threads
        expr: mysql_global_status_threads_running / mysql_global_status_threads_connected * 100 < 30
        for: 2m
        labels:
          severity: warning
        annotations:
          summary: "{{$labels.instance}}: Mysql_Too_Many_sleep_threads detected"
          description: "{{$labels.instance}}: Mysql_sleep_threads percent is more than {{ $value }}, please clean the sleeping threads"
      - alert: Mysql_innodb_Cache_insufficient
        expr: (mysql_global_status_innodb_page_size * on (instance) mysql_global_status_buffer_pool_pages{state="data"} +  on (instance) mysql_global_variables_innodb_log_buffer_size +  on (instance) mysql_global_variables_innodb_additional_mem_pool_size + on (instance)  mysql_global_status_innodb_mem_dictionary + on (instance)  mysql_global_variables_key_buffer_size + on (instance)  mysql_global_variables_query_cache_size + on (instance) mysql_global_status_innodb_mem_adaptive_hash )  / on (instance) mysql_global_variables_innodb_buffer_pool_size * 100 > 80
        for: 2m
        labels:
          severity: warning
        annotations:
          summary: "{{$labels.instance}}: Mysql_innodb_Cache_insufficient detected"
          description: "{{$labels.instance}}: Mysql innodb_Cache was used more than 80% ,(current value is: {{ $value }})"
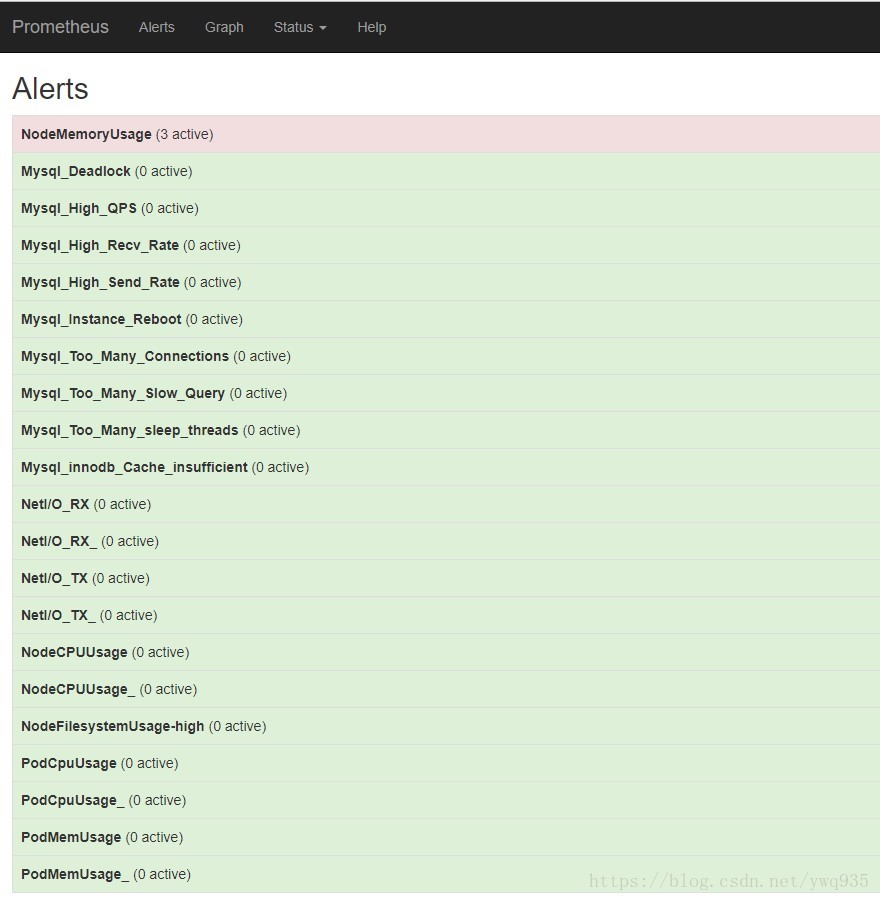
将这些规则更新进prometheus的configmap中,重新apply config,更新prometheus,查看prometheus的告警页面,可以查看多项告警选项,则配置成功。
prometheus 2.0以上版本的新特性,联邦机制,支持从其他的prometheus扩展合并数据,比较类似zabbix的server端与proxy端,适用于跨集群/机房使用,但不同的是prometheus联邦配置非常简单,简单的增加job指定其他prometheus实例服务IP端口,即可获取数据。我们的环境中有两套集群,两个prometheus server实例,在prometheus的configmap配置增加一个如下job配置即可合并数据统一展示:
    - job_name: 'federate'
      scrape_interval: 15s
      honor_labels: true
      metrics_path: '/federate'
      params:
        'match[]':
          - '{job=~"kubernetes-.*"}'
      static_configs:
        - targets:
          - '192.168.9.26:9090'
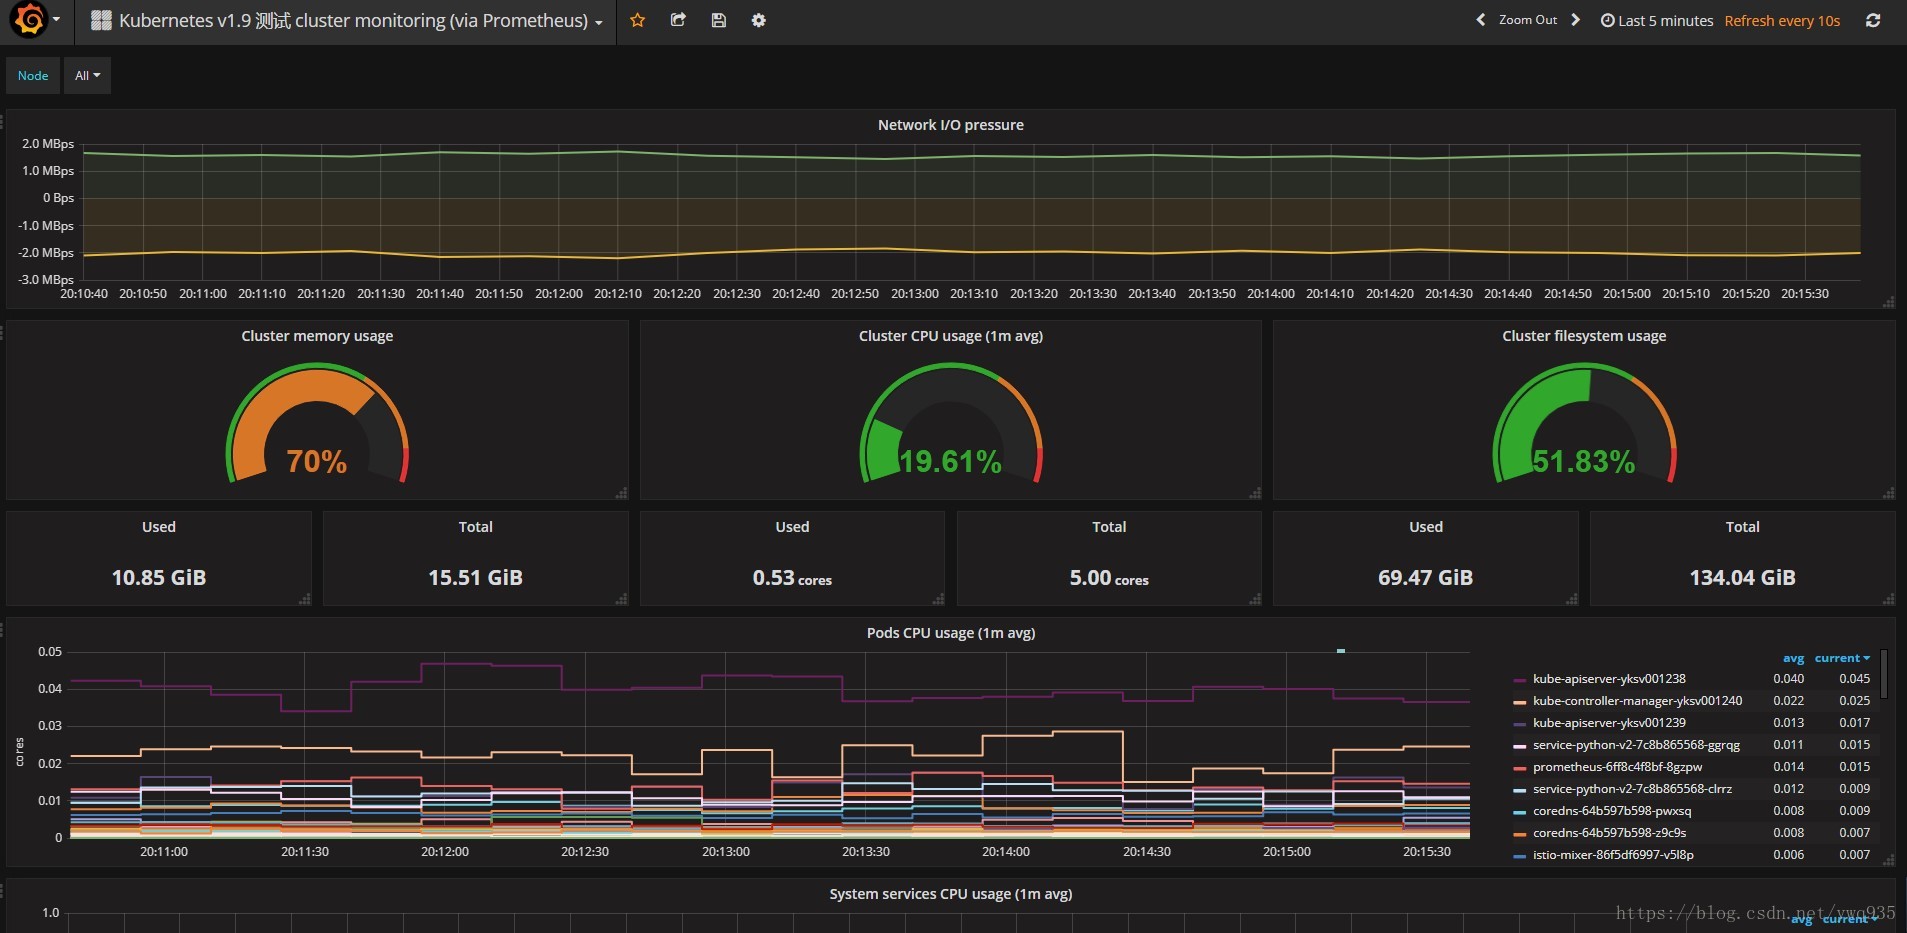
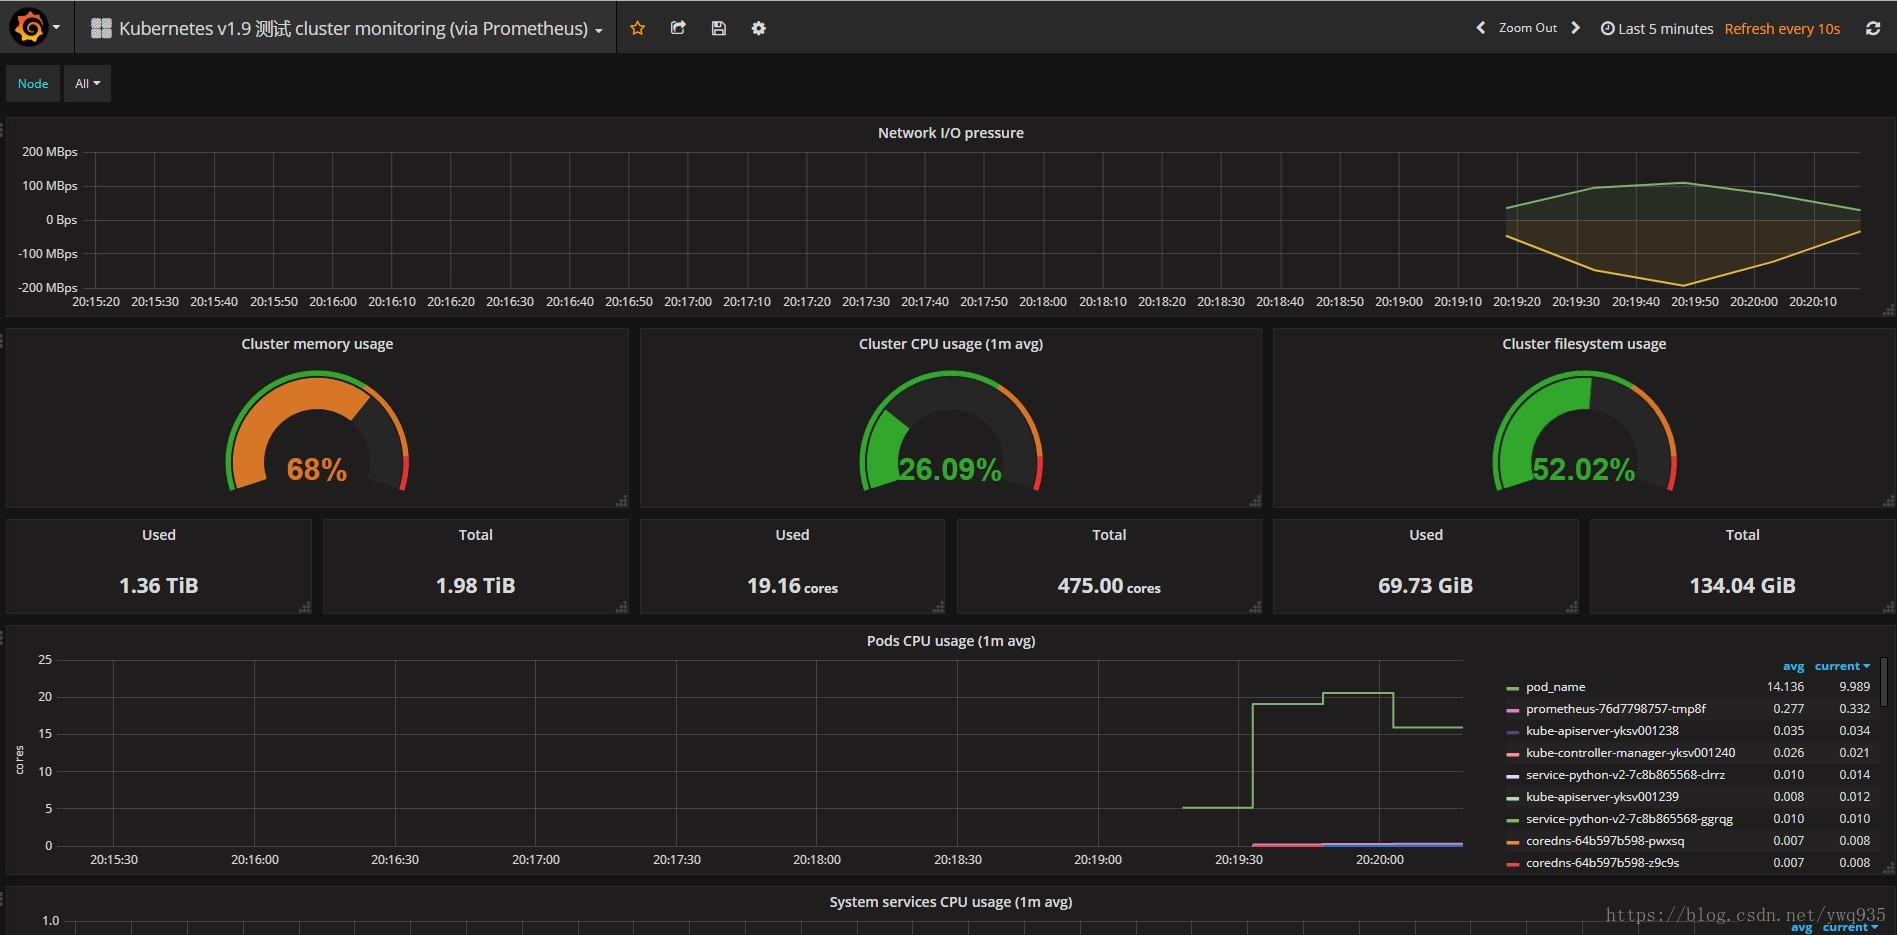
更新配置,更新prometheus pod,重新打开grafana的集群监控模板页面,可以看到数据已经进行了整合:
整合前:
整合后:
Relabel机制可以在Prometheus采集数据存入TSDB之前,通过Target实例的Metadata信息,动态地为Label赋值,可以是metadata中的label,也可以赋值给新label。除此之外,还能根据Target实例的Metadata信息选择是否采集或者忽略该Target实例。
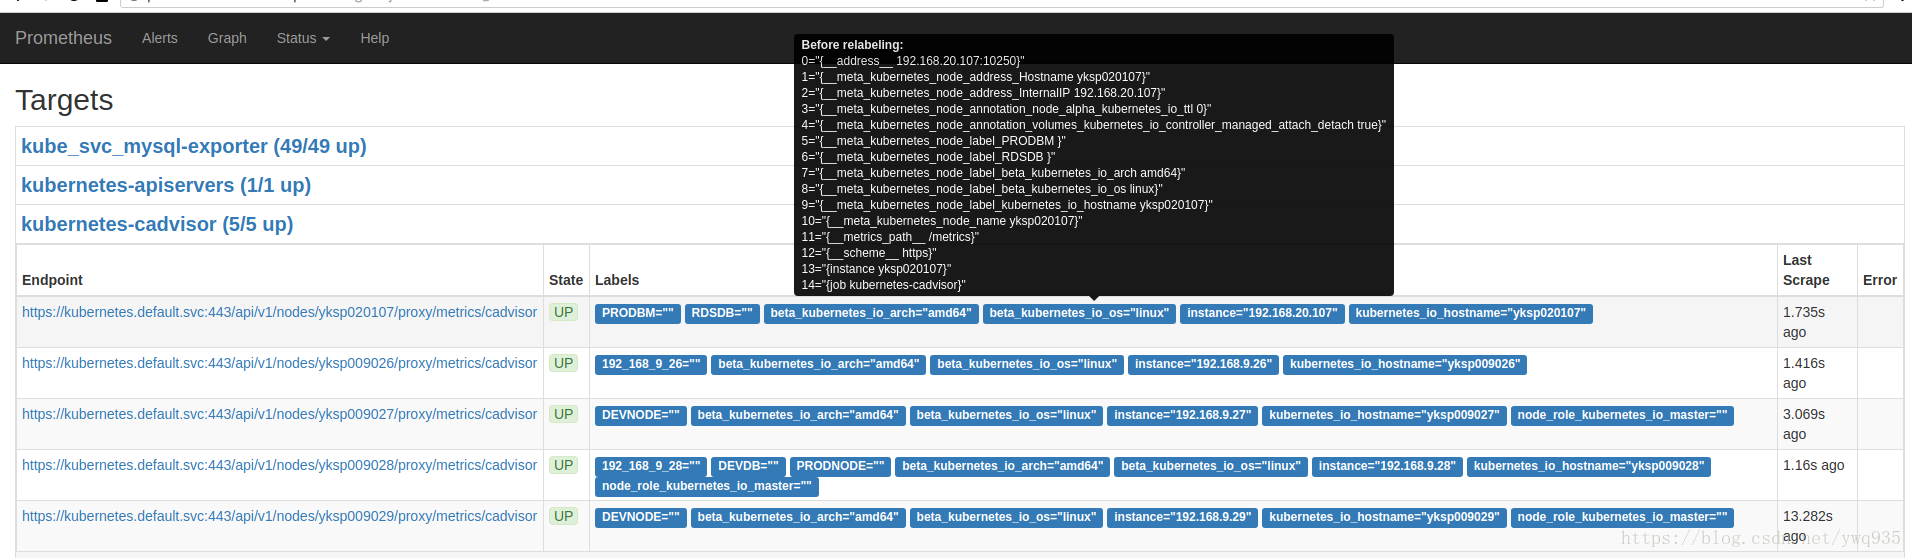
例如这里自定义了如下target:
    - job_name: 'kubernetes-cadvisor'
      kubernetes_sd_configs:
      - role: node
      scheme: https
      tls_config:
        ca_file: /var/run/secrets/kubernetes.io/serviceaccount/ca.crt
      bearer_token_file: /var/run/secrets/kubernetes.io/serviceaccount/token
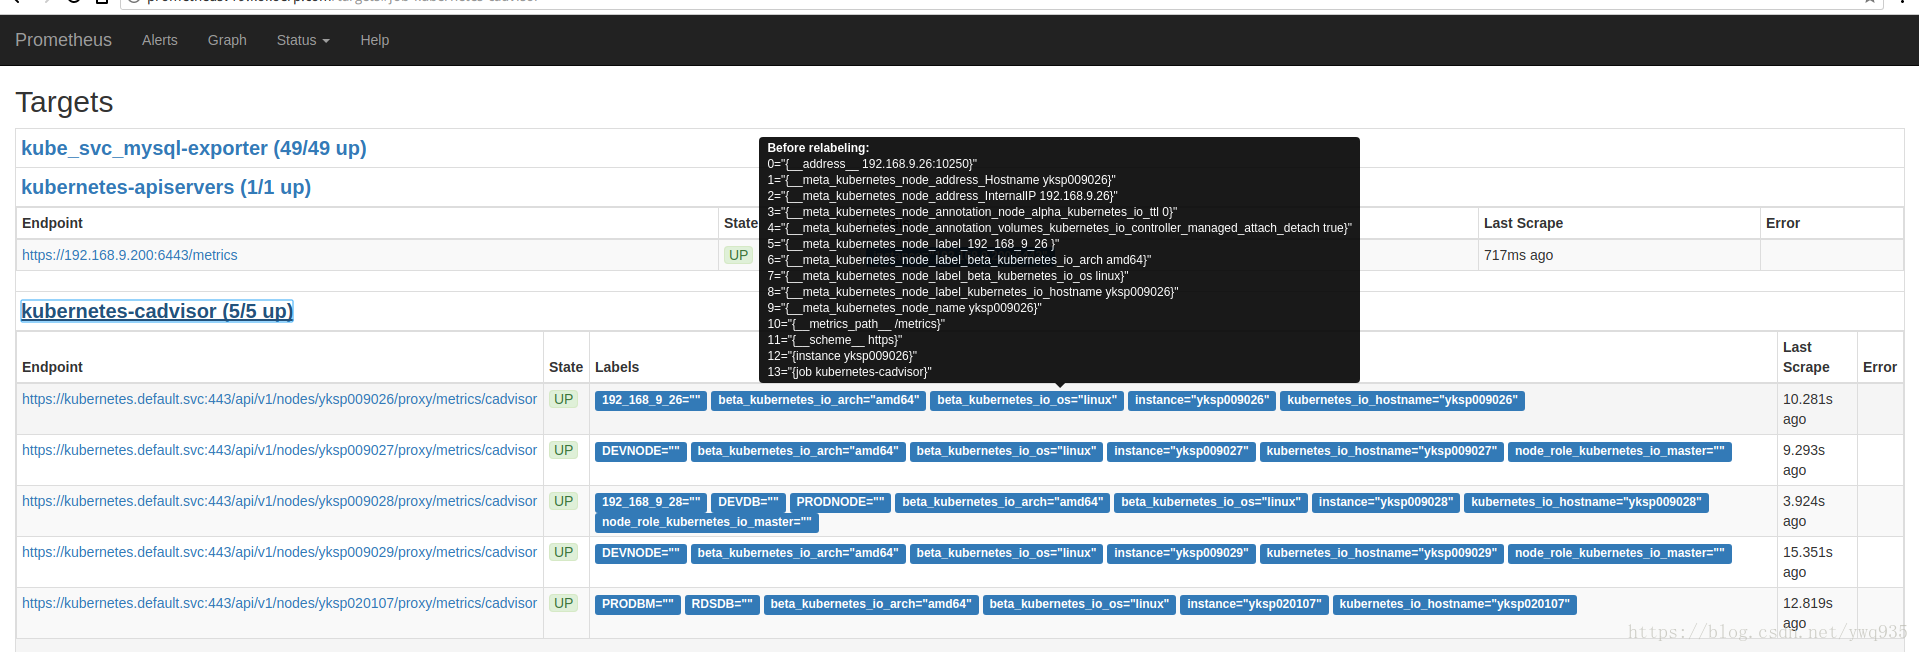
在web上查看target的原始标签:
可以看到instance标签的值为主机名,鼠标悬停展开的黑色框中的标签为metadata标签,form表单里的标签是放入TSDB最终展示的标签
下面给这段配置增加一个自定义标签:
    - job_name: 'kubernetes-cadvisor'
      kubernetes_sd_configs:
      - role: node
      scheme: https
      tls_config:
        ca_file: /var/run/secrets/kubernetes.io/serviceaccount/ca.crt
      bearer_token_file: /var/run/secrets/kubernetes.io/serviceaccount/token
      relabel_configs:
      - source_labels: [__address__]
        regex: (.*):(.*)
        action: replace
        replacement: $1
        target_label: instance
可以看到instance标签的值变成了host的IP地址
relabel配置解析:
 source_labels: [__address__]  #值的来源标签(metadata),__address__是标签名
 regex: (.*):(.*)              #正则匹配表达式
 action: replace               #动作为替换,默认动作
 replacement: $1               #替换的字段,即将正则表达式第一段匹配到的值赋值给target_label
 target_label: instance        #被赋值的标签,可以为metadata中的标签,也可以是自定义的新标签名
通过relabel,可以做一些自定义过滤规则,实现特殊的需求订制
以上就是在上一篇的基础上对prometheus适应生产环境做的一些扩展,当然,需要做的监控项、应用还很多,配置文件、修改后的grafana模板文件随后打包附上,欢迎交流讨论,一起扩展。
如果觉得我的文章对您有用,请随意打赏。你的支持将鼓励我继续创作!