社区微信群开通啦,扫一扫抢先加入社区官方微信群

社区微信群
Prometheus(普罗米修斯)是一套开源的监控&报警&时间序列数据库的组合,起始是由SoundCloud公司开发的。
$ cd /usr/local
$ wget https://github.com/prometheus/prometheus/releases/download/v2.6.0/prometheus-2.6.0.linux-amd64.tar.gz
$ tar xvf prometheus-2.6.0.linux-amd64.tar.gz
$ mv prometheus-2.6.0.linux-amd64 prometheus
$ cd /usr/local/prometheus/
$ vim prometheus.yml
scrape_configs:
 - job_name: 'prometheus'
   static_configs:
   - targets: ['192.168.10.66:9090']

 - job_name: 'linux'
   static_configs:
   - targets: ['192.168.10.66:9100']
     labels:
       instance: db1

 - job_name: 'mysql'
   static_configs:
     - targets: ['192.168.10.66:9104']
       labels:
         instance: db1
$ ./prometheus --config.file=prometheus.yml
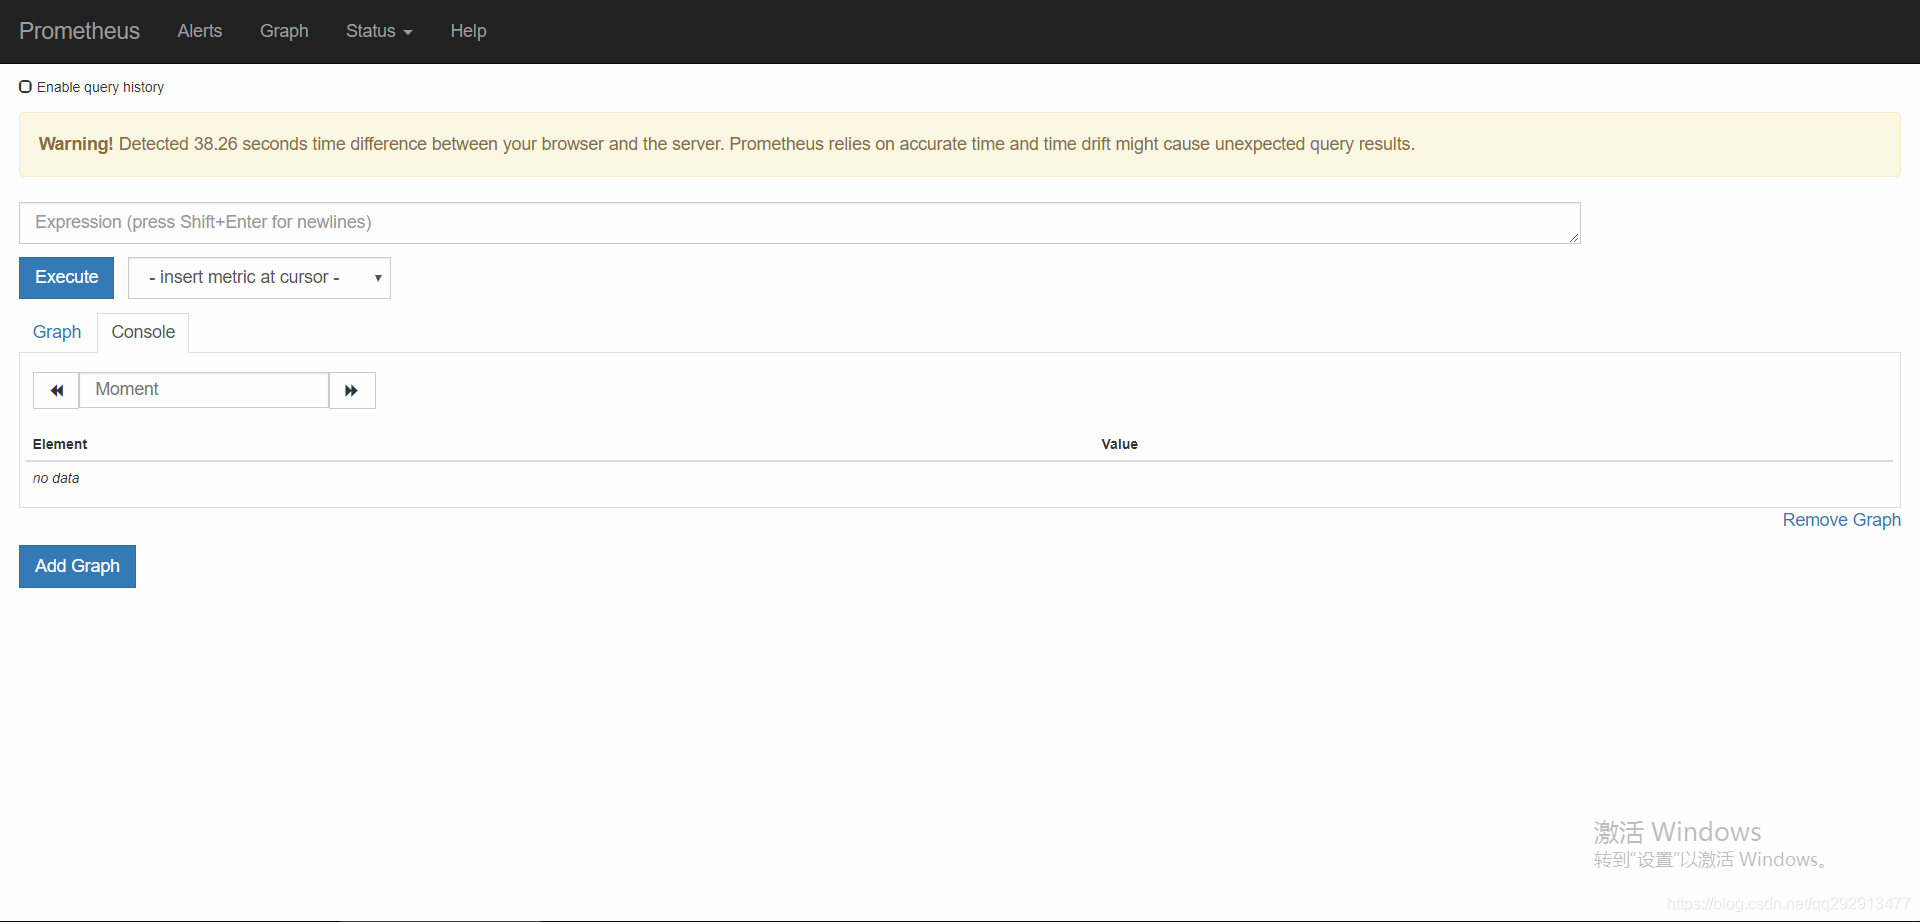
在Status->Targets页面下,可以看到配置的两个Target的State为DOWN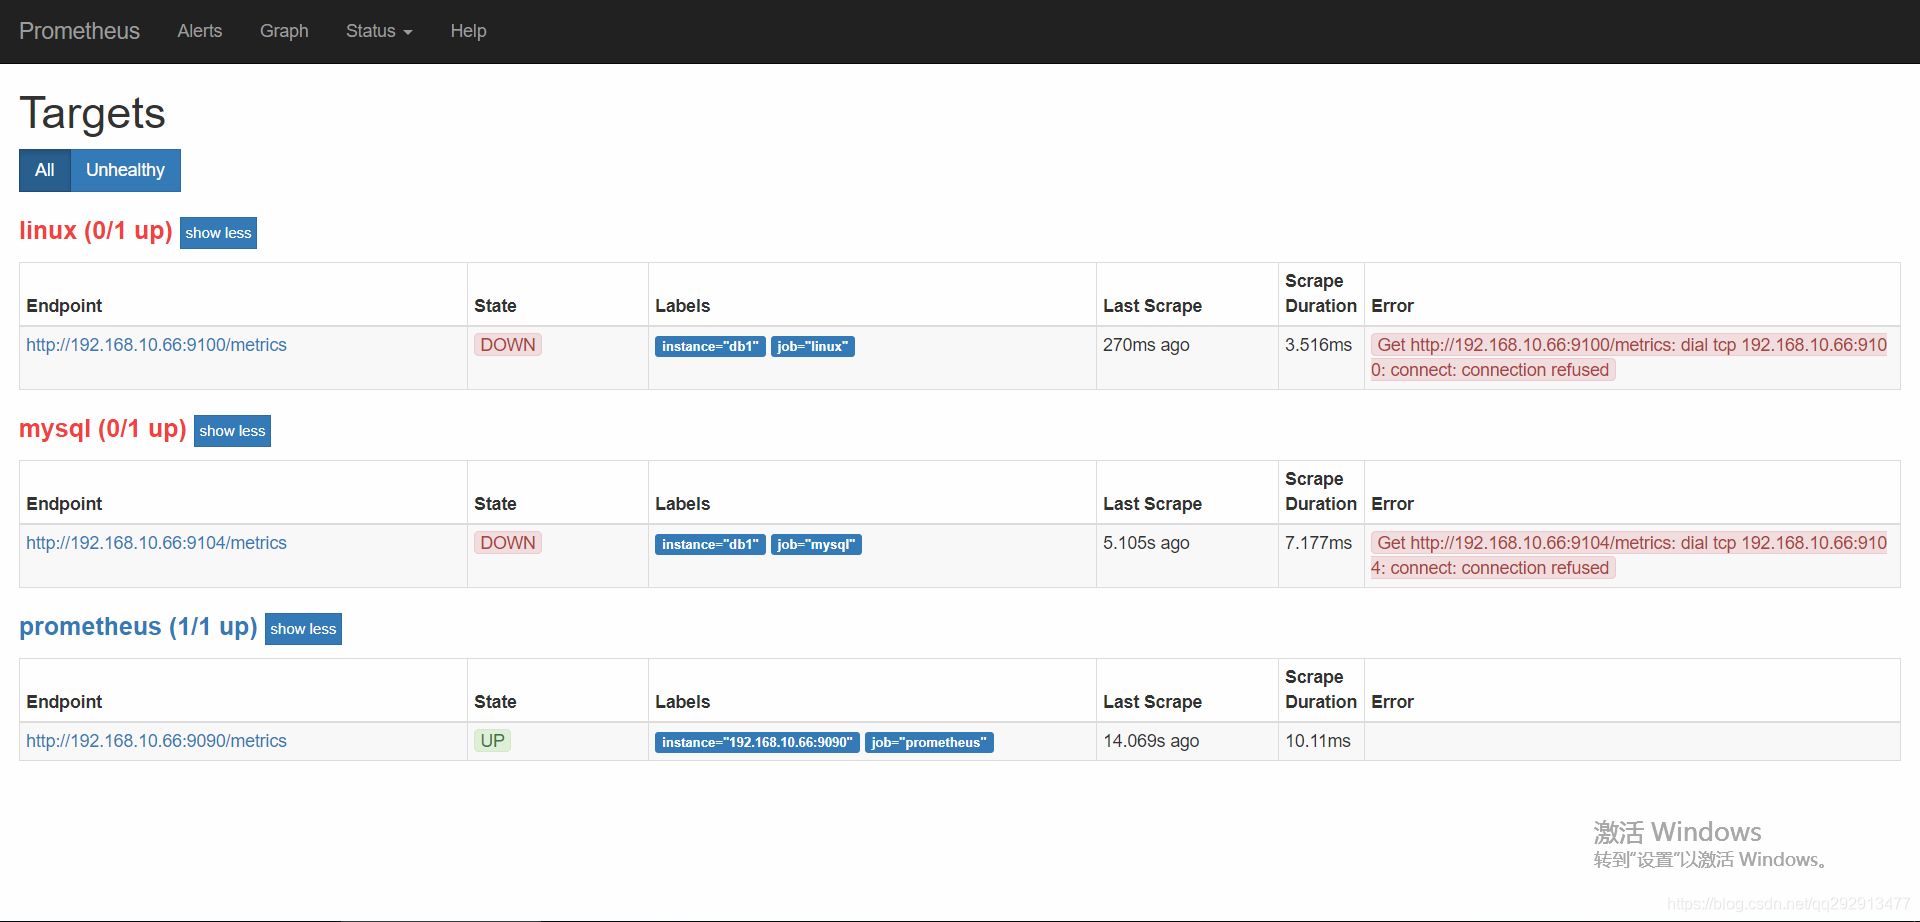
$ wget https://github.com/prometheus/node_exporter/releases/download/v0.14.0/node_exporter-0.14.0.linux-amd64.tar.gz
$ tar xvf node_exporter-0.14.0.linux-amd64.tar.gz /usr/local/
$ nohup /usr/local/node_exporter-0.14.0.linux-amd64/node_exporter &
下载解压
$ wget https://github.com/prometheus/mysqld_exporter/releases/download/v0.10.0/mysqld_exporter-0.10.0.linux-amd64.tar.gz
$ tar xvf mysqld_exporter-0.10.0.linux-amd64.tar.gz /usr/local/
由于mysqld_exporter需要连接到MySQL,创建用户并赋予所需的权限
mysql> GRANT REPLICATION CLIENT,PROCESS ON *.* TO 'mysql_monitor'@'localhost' identified by 'mysql_monitor';
mysql> GRANT SELECT ON *.* TO 'mysql_monitor'@'localhost';
创建.my.cnf配置文件
$ vim /usr/local/mysqld_exporter-0.10.0.linux-amd64/.my.cnf

[client]
user=mysql_monitor
password=mysql_monitor
运行
$ nohup /usr/local/mysqld_exporter-0.10.0.linux-amd64/mysqld_exporter --config.my-cnf="/usr/local/mysqld_exporter-0.10.0.linux-amd64/.my.cnf" &
再刷新Status->Targets页面,可以看到配置的两个Target的State为UP: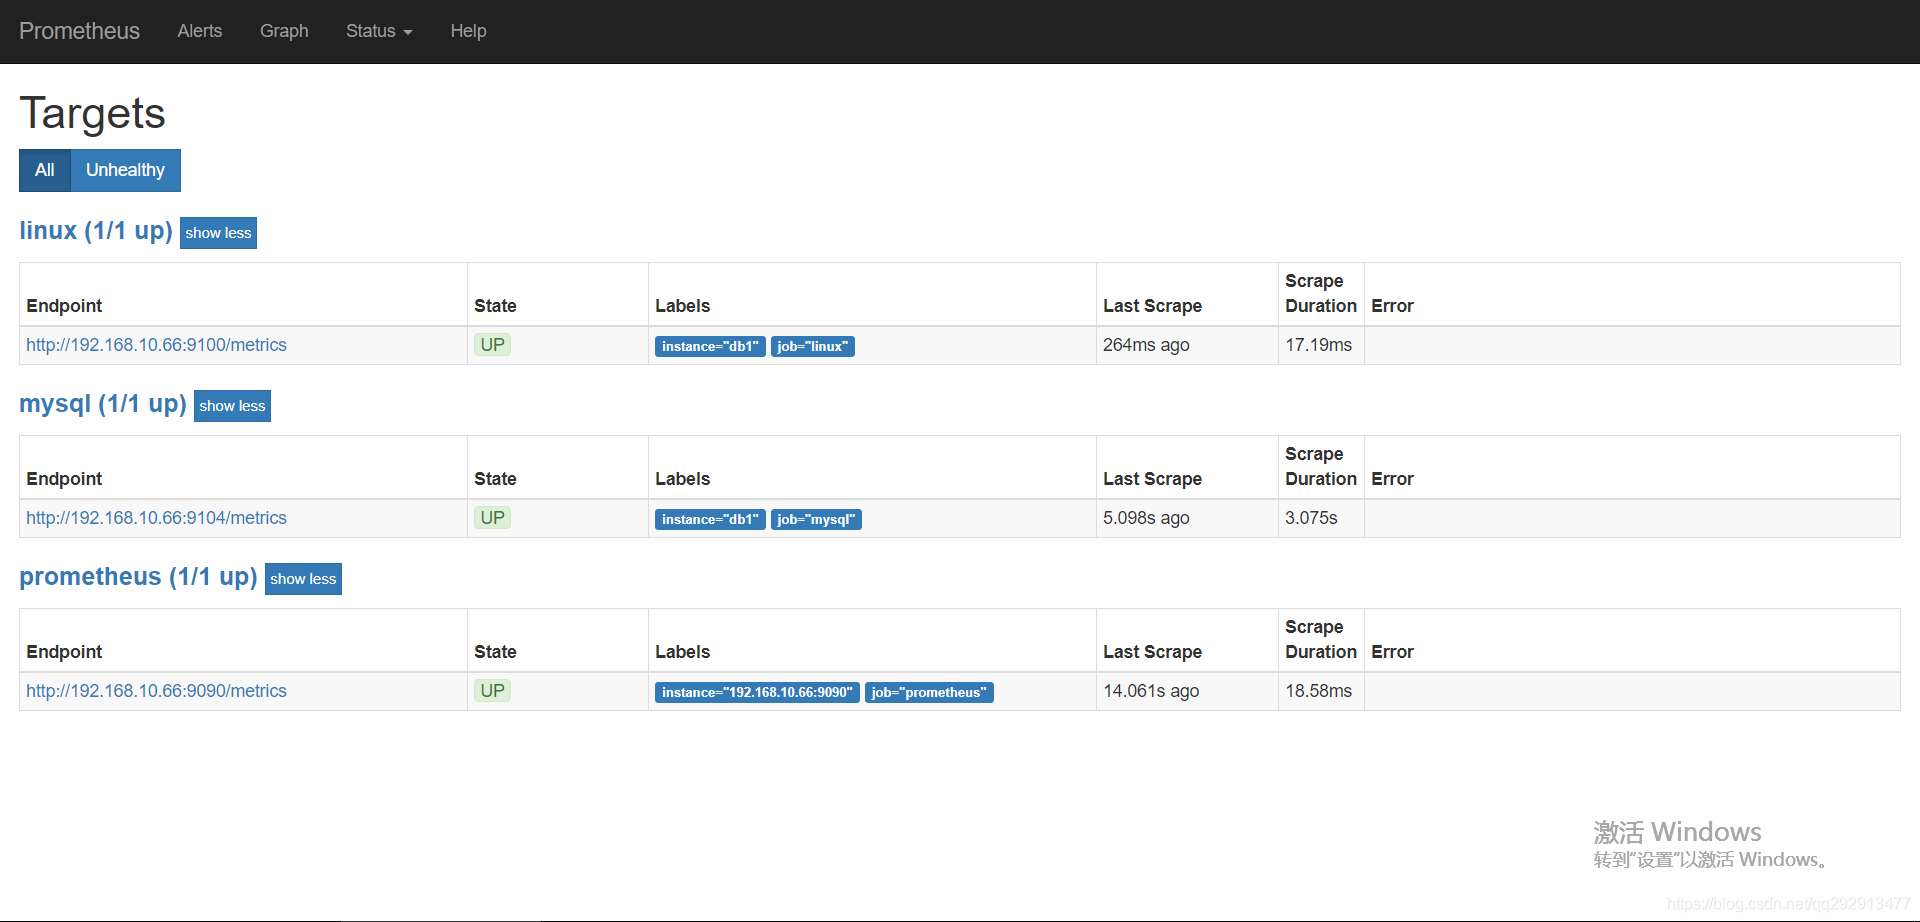
$ wget https://s3-us-west-2.amazonaws.com/grafana-releases/release/grafana-5.0.1-1.x86_64.rpm
$ sudo yum localinstall grafana-5.0.1-1.x86_64.rpm -y
$ systemctl daemon-reload
$ systemctl start grafana-server
$ systemctl status grafana-server
访问
浏览器访问http://monitor_host:3000,出现Grafana界面则表示安装成功(默认帐号/密码为admin/admin):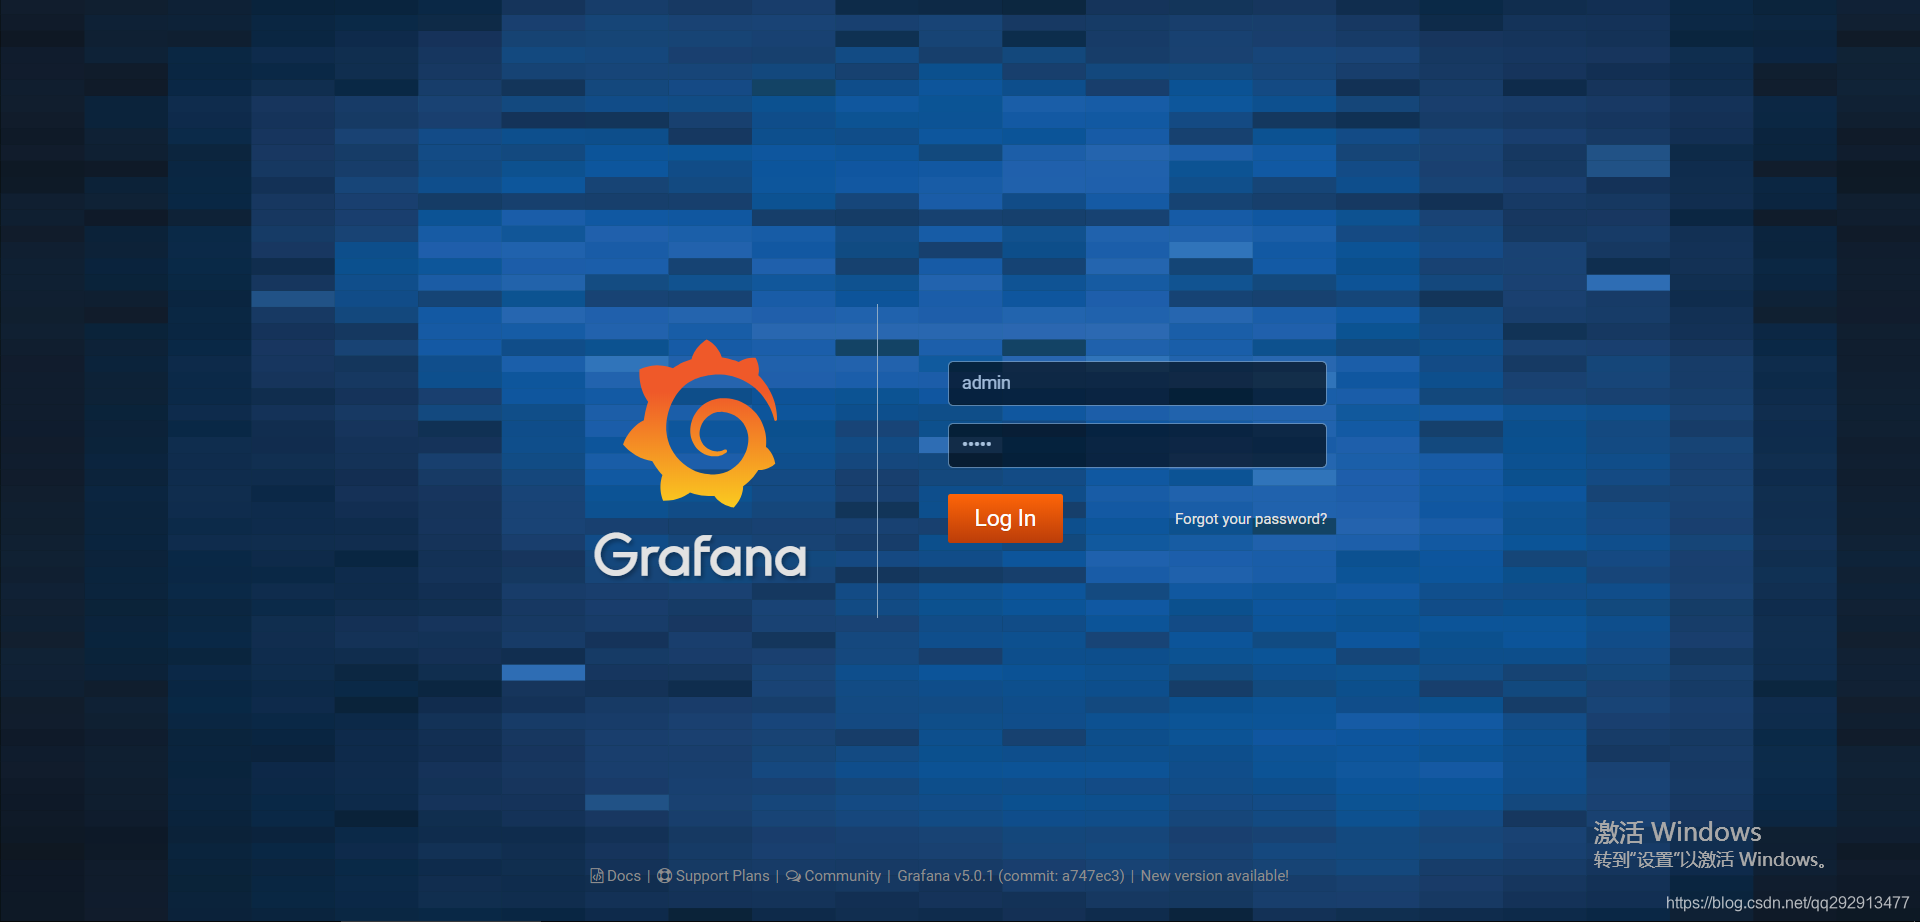
配置Data Resources
登录成功,并点击左侧边栏进入Configuration->Data Resources配置数据源如下: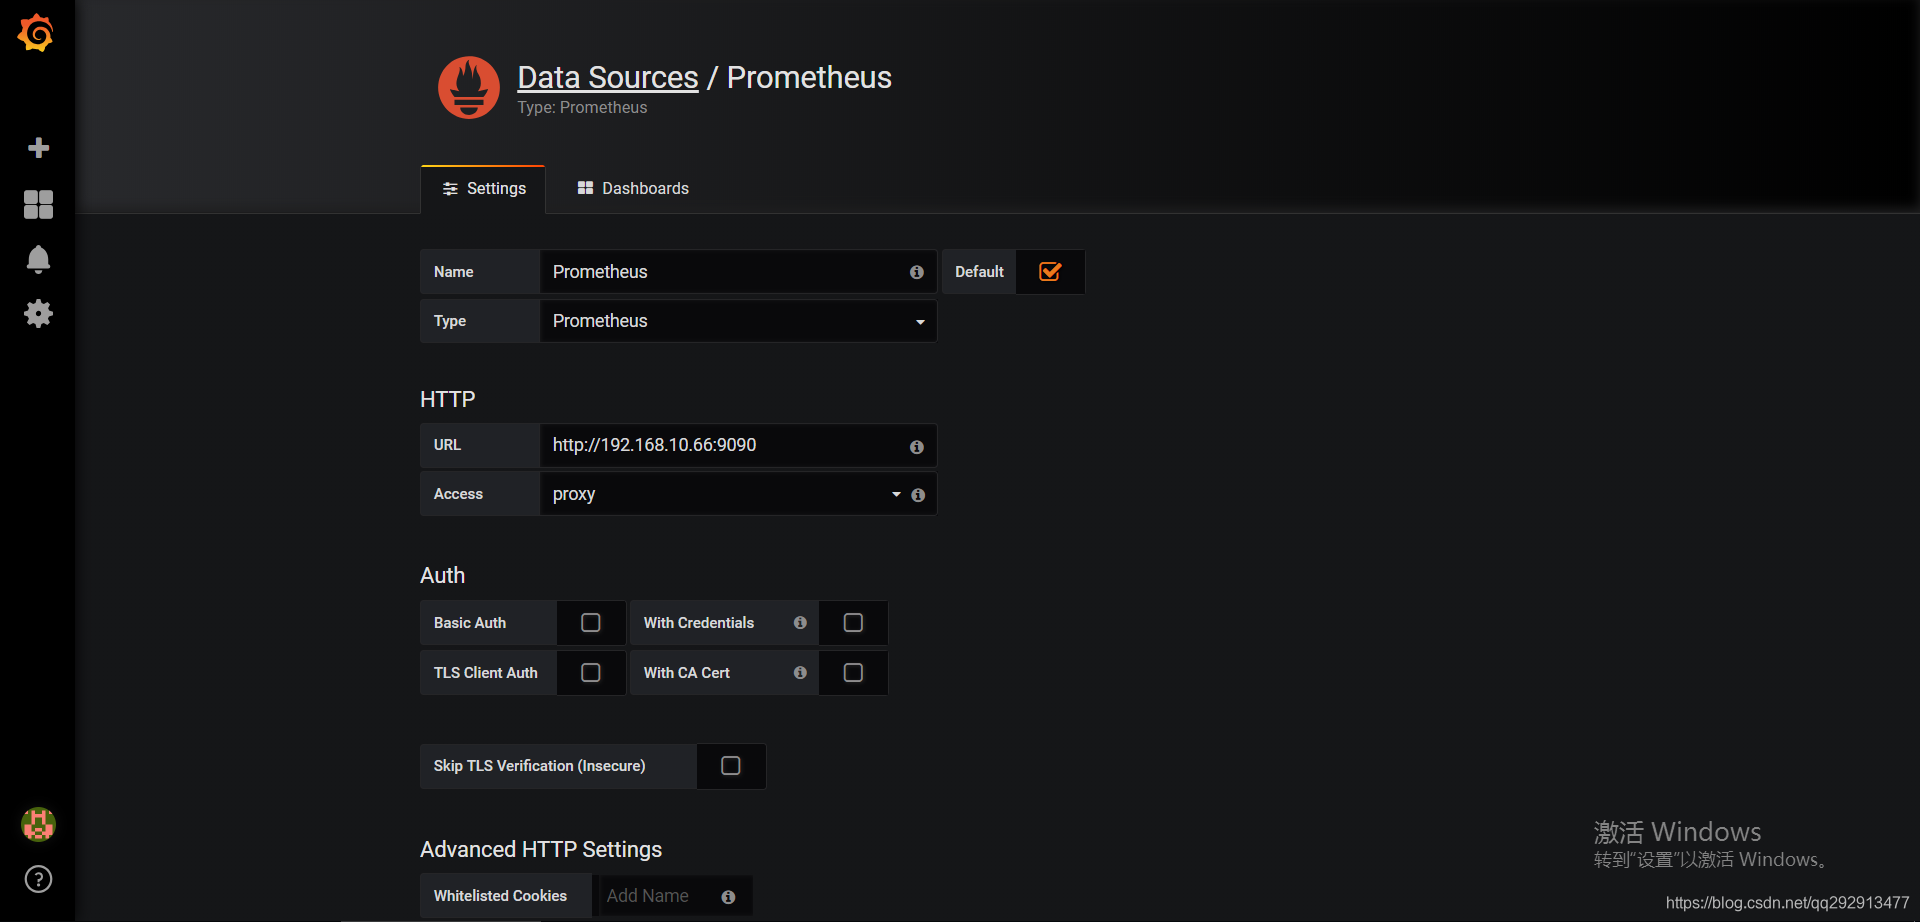
导入Dashboards
1.可在Grafana官网自行选择dashboards:https://grafana.com/dashboards
2.本文使用的是percona提供的dashboards:https://github.com/percona/grafana-dashboards/tree/master/dashboards
点击左侧边栏进入Create->Import导入Dashboards:
导入System_Overview.json(https://github.com/percona/grafana-dashboards/blob/master/dashboards/System_Overview.json)
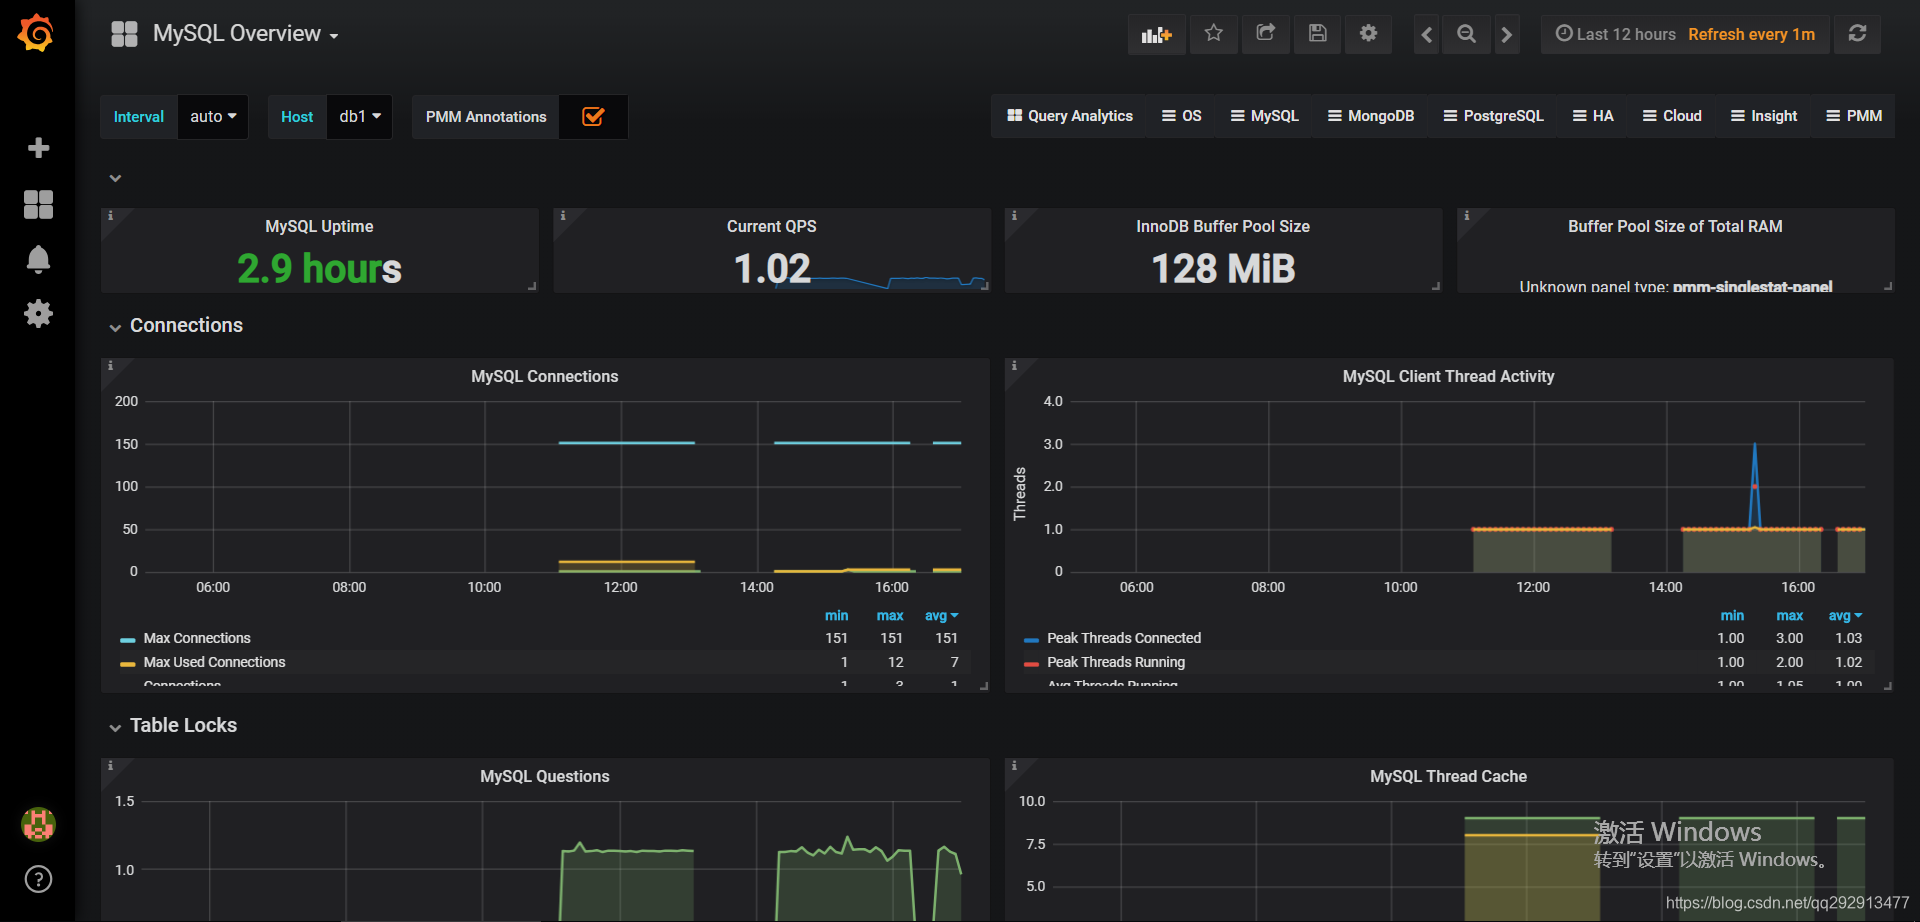
导入MySQL_Overview.json(https://github.com/percona/grafana-dashboards/blob/master/dashboards/MySQL_Overview.json)
以上为个人安装总结,如有问题欢迎指出!
如果觉得我的文章对您有用,请随意打赏。你的支持将鼓励我继续创作!
