社区微信群开通啦,扫一扫抢先加入社区官方微信群

社区微信群
前段时间项目中遇到golang程序的性能上不去,想要找到程序的性能瓶颈所在,使用golang自带的pprof输出cpu和mem的profile文件进行分析。
具体如何生成profile文件参考如下:
https://golang.org/pkg/runtime/pprof/
https://blog.golang.org/profiling-go-programs
建议可以在程序中设置监听signal的程序,监听一个SIGUSR1的goroutine,在命令行中输入:
kill -s SIGUSR1 < Pid >
当收到这个信号之后再去触发生成一个30s~1min的profile,这样就可以在跑着正常traffic的情况下收集到真实运行的一个profile了(相比较于net/http/pprof要启动一个http服务来说,这种方式更轻便)。
从输出的profile文件来看,程序中的runtime.mallocgc占据了很长的CPU时间片,初步怀疑是GC占据了太多的CPU使用,于是打开golang的GCDEBUG开关,查看GC信息。
通过设置环境变量“GODEBUG”开启GC日志:
GODEBUG=gctrace=1
从GC日志来看,GC占用了6%了CPU时间片,这已经挺严重的了:
gc 3 @46.886s 6%: 0.006+39+0.004 ms clock, 0.006+36/2.2/0.8+0.004 ms cpu, 420->435->210 MB, 420 MB goal, 1 P
对上述gc日志相关输出解释如下:
| filed | 说明 |
|---|---|
| gc 3 | 表示发生GC的次数,每次GC递增。比如gc 3,表示第3次gc的情况; |
| @46.886s | 表示程序执行的总时间 |
| 6% | 表示gc时时间和程序运行总时间的百分比 |
| 0.006+39+0.004 ms clock | 表示第一次STW + 标记(Marking) + 第二次STW的时钟时间,单位是ms。比如0.006+39+0.004 ms clock,表示第一次STW持续的时间时钟时间是0.006ms,第二次STW持续的时钟时间是0.004ms,标记Marking处理持续的时钟时间是39ms; |
| 0.006+36/2.2/0.8+0.004 ms cpu | 表示第一次STW + Mark assist/Mark(Dedicated + Fractional)/Mark(Idle) + 第二次STW的CPU时间。与时钟时间的统计不同,CPU时间会对各个核上对应的处理时间进行累加。比如0.006+36/2.2/0+0.004 ms cpu,0.006ms表示第一次STW过程中,被STW的多个核的时钟时间之和,其值大于等于对应时钟时间。36ms表示在整个Mark过程中,进行assist Mark的CPU累计时间。2.2ms表示在整个Mark过程中,在gcMarkWorkerDedicatedMode和gcMarkWorkerFractionalMode两种工作模式下进行Mark处理的CPU累计时间之和。0.8ms表示在gcMarkWorkerIdleMode模式下进行Mark处理的CPU累计时间之和。0.004ms表示第二次被STW的多个核的时钟时间之和; |
| 420->435->210 MB | 表示GC开始前申请的内存大小 -> GC标记(Mark)结束后申请的内存大小 -> 被标记存活的内存大小。比如420->435->210 MB,表示GC开始前一共申请了420MB的内存,GC标记(Mark)处理完后一共申请了435MB的内存,也就说在整个标记阶段,又新申请了15MB的内存,标记阶段一共标记了210MB的内存,就是说有435MB-210MB=225MB的内存可以被回收; |
| 420 MB goal | 目标堆大小 |
| 1 P | 占用核个数 |
从上述gc日志来看,程序到了420MB的时候就触发了GC,程序在高QPS情况下,堆内存增加是很正常的,并且我们给了足够多的memory(5Gi),毕竟现在memory相对于CPU来说更不值钱,用memory换高性能是我们可以接受的。
所以我们尝试去寻找GC相关参数,看看能不能不把这个GC的触发点变大,这样GC就不会频繁了。在golang的runtime文档中,我们发现了GOGC这个参数,关于这个参数的解释如下:
The GOGC variable sets the initial garbage collection target
percentage. A collection is triggered when the ratio of freshly
allocated data to live data remaining after the previous collection
reaches this percentage. The default is GOGC=100. Setting GOGC=off
disables the garbage collector entirely. The runtime/debug package’s
SetGCPercent function allows changing this percentage at run time. See
https://golang.org/pkg/runtime/debug/#SetGCPercent.
什么意思呢,就是GOGC默认值是100,举个例子:你程序的上一次GC完,驻留内存是100MB,由于你GOGC设置的是100,所以下次你的内存达到200MB的时候就会触发一次GC,如果你GOGC设置的是200,那么下次你的内存达到300MB的时候就会触发GC。
从runtime包中GC的源码SetGCPercent来看,确实是上述策略
// defaultHeapMinimum is the value of heapminimum for GOGC==100.
const defaultHeapMinimum = 4 << 20

// Initialized from $GOGC.  GOGC=off means no GC.
var gcpercent int32

//go:linkname setGCPercent runtime/debug.setGCPercent
func setGCPercent(in int32) (out int32) {
	lock(&mheap_.lock)
	out = gcpercent
	if in < 0 {
		in = -1
	}
	gcpercent = in
	heapminimum = defaultHeapMinimum * uint64(gcpercent) / 100
	// Update pacing in response to gcpercent change.
	gcSetTriggerRatio(memstats.triggerRatio)
	unlock(&mheap_.lock)

	// If we just disabled GC, wait for any concurrent GC mark to
	// finish so we always return with no GC running.
	if in < 0 {
		gcWaitOnMark(atomic.Load(&work.cycles))
	}

	return out
}
而我们的程序中内存分的是5G啊,从GC日志来看,驻留内存大约稳定在200~300MB,所以我将GOGC这个值调整到了400,重新跑了一次,发现性能比之前提升了许多,查看GC日志,发现现在GC仅仅只占时间片的1%,满足了我们这次的GC调优。
从上述调优过程中,虽然可以简单的解决问题,但不免产生一个新的问题,为什么golang要将默认值设成100,我改成400会不会引发新的问题?思考一下就会发现,如果当驻留内存过大,比如在我们当前配置下,驻留内存超过1G,那么就会到5G才会触发GC,而程序分配内存只有5G,内存不够用又没有触发GC,程序会不会OOM呢(OutOfMemory)?
果然,没过多久从测试那边反馈过来的信息,程序OOM了,一检查,发现程序驻留内存飙升,导致GC threshold也飙升上去了,迟迟不能触发GC,新来的请求无法分配到内存,直接程序crash了。虽然最后检查出来,是测试那边数据配置的问题,但这种情况该如何避免呢?
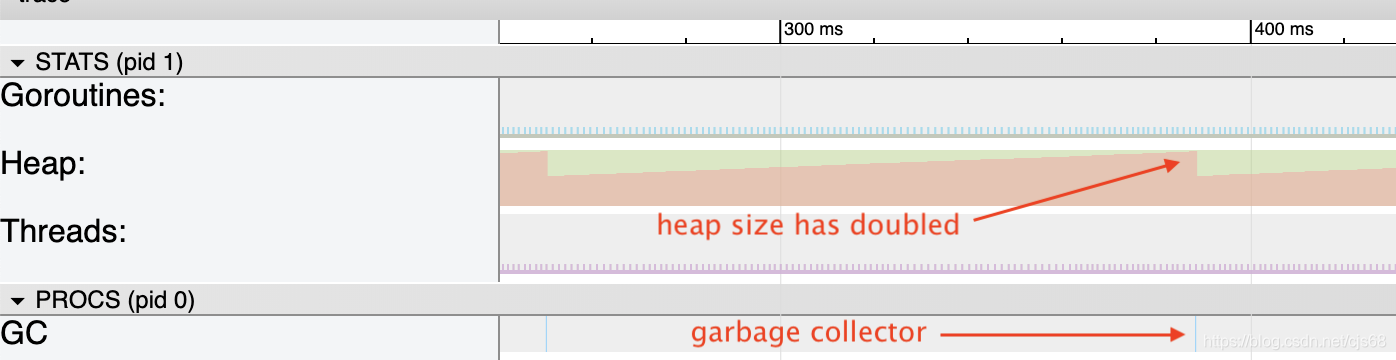
1. 内存达到上限触发GC
就像上面的GOGC配置那样,当程序达到驻留内存的相应倍数时候,触发GC, 默认值就是两倍于当前内存。
func BenchmarkAllocationEveryMs(b *testing.B) {
	// need permanent allocation to clear see when the heap double its size
	var s *[]int
	tmp := make([]int, 1100000, 1100000)
	s = &tmp

	var a *[]int
	for i := 0; i < b.N; i++  {
		tmp := make([]int, 10000, 10000)
		a = &tmp

		time.Sleep(time.Millisecond)
	}
	_ = a
	runtime.KeepAlive(s)
}
2. 时间达到触发GC的阈值
垃圾收集器关注的第二个指标是两个垃圾收集器之间的延迟。如果它没有被触发超过两分钟,一个循环将被强制。
GC trace日志:
GC forced
gc 15 @121.340s 0%: 0.058+1.2+0.015 ms clock, 0.46+0/2.0/4.1+0.12 ms cpu, 1->1->1 MB, 4 MB goal, 8 P
这是golang目前的GC策略,参考博客Go: How Does the Garbage Collector Watch Your Application?
那么问题来了,如果程序一段时间内驻留内存飙升,并且GC没法立马把这些内存给回收,那么会导致下一次GC的阈值上去,压根没法触发GC,程序肯定会OOM的。这个很显而易见的问题,我都能想到,golang应该不会考虑不到啊,果然在golang 的blog里面https://blog.golang.org/ismmkeynote
Go comes with two knobs to control the GC. The first one is GCPercent.
Basically this is a knob that adjusts how much CPU you want to use and
how much memory you want to use. The default is 100 which means that
half the heap is dedicated to live memory and half the heap is
dedicated to allocation. You can modify this in either direction.MaxHeap, which is not yet released but is being used and evaluated
internally, lets the programmer set what the maximum heap size should
be. Out of memory, OOMs, are tough on Go; temporary spikes in memory
usage should be handled by increasing CPU costs, not by aborting.
Basically if the GC sees memory pressure it informs the application
that it should shed load. Once things are back to normal the GC
informs the application that it can go back to its regular load.
MaxHeap also provides a lot more flexibility in scheduling. Instead of
always being paranoid about how much memory is available the runtime
can size the heap up to the MaxHeap.
还是有MaxHeap这种策略的,只是这种策略目前还没有正式发布(有点坑……),只能等待golang后续发布的版本中解决这个GC问题吧。
更新:
发现setMaxHeap这个策略从2017年就有相关代码改进了,结果到现在这个code还没进,https://groups.google.com/forum/#!topic/golang-codereviews/brkajcJ0mhI,一个功能改了两三年还没进,也是可以了=_=!
如果觉得我的文章对您有用,请随意打赏。你的支持将鼓励我继续创作!
