社区微信群开通啦,扫一扫抢先加入社区官方微信群

社区微信群
使用pprof和Graphviz结合来分析golang程序的性能问题。
1、pprof
golang官方用来做监控分析的库,一般都是pprof,我们这里使用的net/http/pprof可以做到直接看到当前web服务的状态,包括cpu,内存等的使用情况。
2、Graphviz
Graphviz (英文:Graph Visualization Software的缩写)是一个由AT&T实验室启动的开源工具包,用于绘制DOT语言脚本描述的图形。它也提供了供其它软件使用的函式库。什么是Graphviz
1、Graphviz
下载graphviz,zip和mis看个人情况,都可以,这边使用的是2.38 Stable Release的zip,解压后直接使用。
解压或者安装后设置环境变量: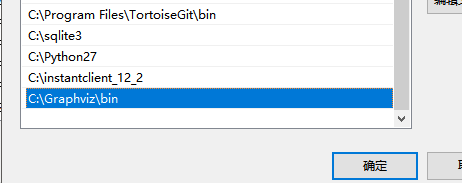
2、pprof
官方自带,无需单独安装下载,但是需要有一段代码来调用,以下是封装的一个包。
package pprof

import (
	"fmt"
	"net/http"
	_ "net/http/pprof"
	"os"
	"runtime"
	"runtime/debug"
	"runtime/pprof"
	"runtime/trace"
)

func Pprof() {
	go func() {
		//默认是关闭GC的
		debug.SetGCPercent(-1)
		//运行trace
		http.HandleFunc("/start", traces)
		//停止trace
		http.HandleFunc("/stop", traceStop)
		//手动GC
		http.HandleFunc("/gc", handleGC)
		//网站开始监听
		http.ListenAndServe(":6060", nil)
	}()
}

//运行trace
func traces(w http.ResponseWriter, r *http.Request) {
	if err := startTrace(); err != nil {
		fmt.Println("启动trace pprof失败")
		w.Write([]byte("启动trace pprof失败"))
	}
	if err := startCPU(); err != nil {
		fmt.Println("启动cpu pprof失败")
		w.Write([]byte("启动cpu pprof失败"))
	}

	if err := saveMem(); err != nil {
		fmt.Println("存储mem pprof失败")
		w.Write([]byte("存储mem pprof失败"))
	}
	if err := saveBlock(); err != nil {
		fmt.Println("存储groutine block pprof失败")
		w.Write([]byte("存储groutine pprof失败"))
	}
	fmt.Println("启动cpu pprof,存储mem pprof,存储groutine pprof成功")
	w.Write([]byte("启动trace pprof, cpu pprof,存储mem pprof,存储groutine pprof成功"))
}

//停止tintrace
func traceStop(w http.ResponseWriter, r *http.Request) {
	stopCpuProf()
	stopTrace()
	fmt.Println("停止trace pprof,cpu pprof成功")
	w.Write([]byte("停止trace pprof,cpu pprof成功"))
}

var fCPU *os.File = nil
var fTrace *os.File = nil

//启动cpu
func startCPU() error {
	var err error
	fCPU, err = os.Create("cpu.prof")
	if err != nil {
		fmt.Println("创建cpu的pprof文件失败,错误:%v", err)
		fCPU.Close()
		return err
	}
	if err := pprof.StartCPUProfile(fCPU); err != nil {
		fmt.Println("写入cpuPprof文件存储失败,错误:%v", err)
		fCPU.Close()
	}
	return nil
}

//停止cpu
func stopCpuProf() {
	pprof.StopCPUProfile()
	fCPU.Close()
}

//启动trace
func startTrace() error {
	var err error
	fTrace, err = os.Create("trace.out")
	if err != nil {
		fmt.Println("创建trace pprof文件失败,错误:", err)
		return err
	}

	if err = trace.Start(fTrace); err != nil {
		fmt.Println("启动trace pprof文件失败,错误:", err)
		return err
	}
	return nil
}

//停止trace
func stopTrace() {
	trace.Stop()
	fTrace.Close()
}

//手动GC
func handleGC(w http.ResponseWriter, r *http.Request) {
	runtime.GC()
	w.Write([]byte("启动GC"))
}

//内存
func saveMem() error {
	f, err := os.Create("mem.prof")
	if err != nil {
		fmt.Println("创建mem的pprof文件失败,错误:%v", err)
		return err
	}

	if err := pprof.WriteHeapProfile(f); err != nil {
		fmt.Println("写入memPprof文件存储失败,错误:%v", err)
	}
	f.Close()
	return nil
}

//groutine block
func saveBlock() error {
	f, err := os.Create("block.prof")
	if err != nil {
		fmt.Println("创建block文件存储失败,错误:%v", err)
		return err
	}

	if err := pprof.Lookup("block").WriteTo(f, 0); err != nil {
		fmt.Println("写入block的pprofPprof文件失败,错误:%v", err)
	}
	f.Close()
	return nil
}
在main函数的开头出调用即可:
package main

import (
	"github.com/luciferofwg/pprof"
	"time"
)

func main() {
	go pprof.Pprof()
	go func() {
		Factorial(1000)
	}()
	for {
		time.Sleep(time.Duration(time.Second * 1))
	}
}

func Factorial(n uint64) (result uint64) {
	if n > 0 {
		result = n * Factorial(n-1)
		return result
	}
	return 1
}
到此呢,我们就把前期的准备工作完成了,接下来我们来生成对应的文件。
注意:debug.SetGCPercent(100)是GC的设置,源码中的注释:
// SetGCPercent sets the garbage collection target percentage:
// a collection is triggered when the ratio of freshly allocated data
// to live data remaining after the previous collection reaches this percentage.
// SetGCPercent returns the previous setting.
// The initial setting is the value of the GOGC environment variable
// at startup, or 100 if the variable is not set.
// A negative percentage disables garbage collection.
func SetGCPercent(percent int) int {
	return int(setGCPercent(int32(percent)))
}
我这边是自动GC
首先 启动 你要检测的程序,程序跑起来之后,我们需要给上面封装的6060端口上发送开始采集pprof数据命令,然后会在程序所在的目录下生成几个文件。待时机适当的时候(决定于你关注的性能瓶颈),再发送停止指令停止采集,然后就可以分析采集的数据了。
开始:http://localhost:6060/start
停止:http://localhost:6060/stop
注:发送指令可以在浏览器或者postman发送。
1、生成到本地
生成的文件: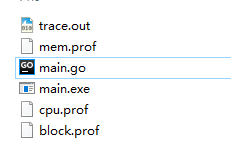
此时trace的数据已经生成到了本地,然后在本目录打开cmd,输入go tool trace trace.out启动trace的分析器,等待分析完成后会自动打开浏览器,此时就可以在浏览器查看所有的trace信息了,如图:
分析器分析的过程:
分析完成后浏览器中的内容: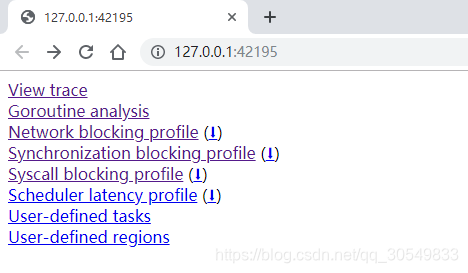
这一块类容比较多我们在 pprof性能分析2 中详细看,其余的数据详见下节 实时查看 。
2、实时查看
同样的,程序必须是在运行的情况下且发送了start指令。
1)web端实时查看
在浏览器上输入地址 http://localhost:6060/debug/pprof/ 即可看到当前时刻的性能数据,如下图: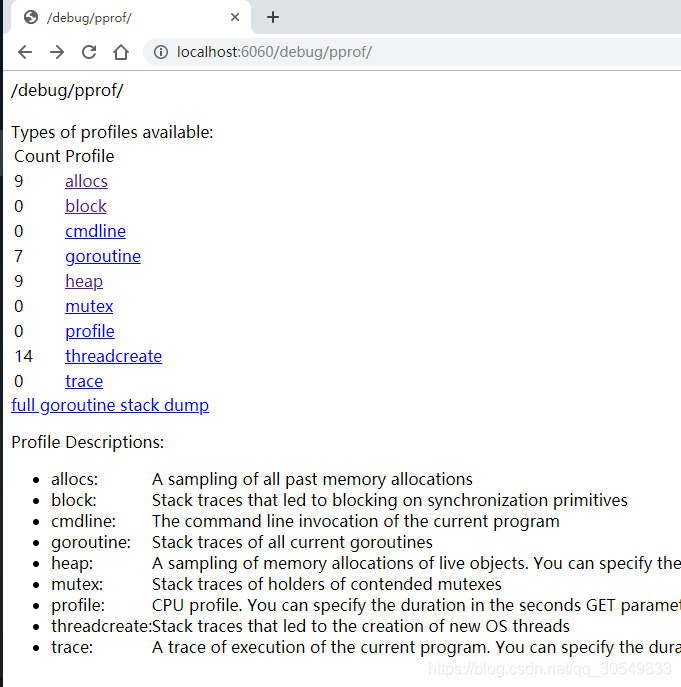
其中 allocs 、goroutine、heap、可以查看到top10的数据,都具体到了函数: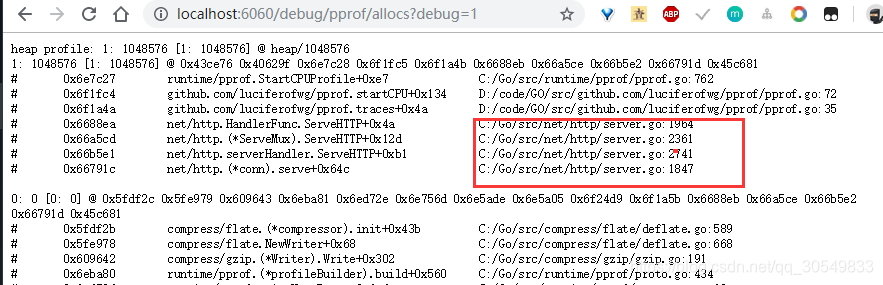
相对是比较清楚的,这时候可以作为性能分析的一个依据了。
2)终端查看
打开cmd命令行,输入:go tool pprof http://localhost:6060/debug/pprof/profile 查看cpu的使用情况;go tool pprof http://localhost:6060/debug/pprof/heap 查看heap的使用情况;go tool pprof http://localhost:6060/debug/pprof/mem 查看mem的使用情况;go tool pprof http://localhost:6060/debug/pprof/block 查看block的使用情况;go tool pprof http://localhost:6060/debug/pprof/goroutines 查看goroutines的使用情况;go tool pprof http://localhost:6060/debug/pprof/mutex 查看mutex的使用情况;go tool pprof http://localhost:6060/debug/pprof/threadcreate 查看threadcreate的使用情况;
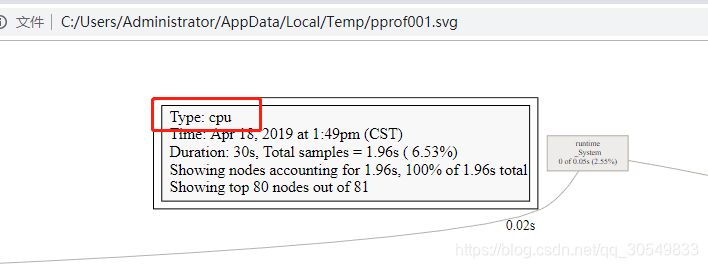
访问本地的6060端口查看生成的数据,输入相关的命令可查看对应的数据,比如输入web时,分析图: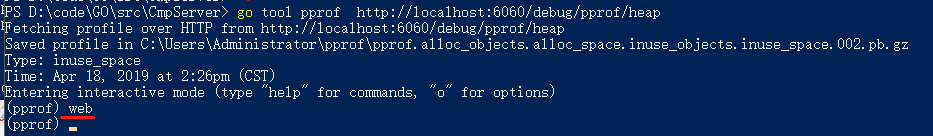
profile(CPU)分析结果图: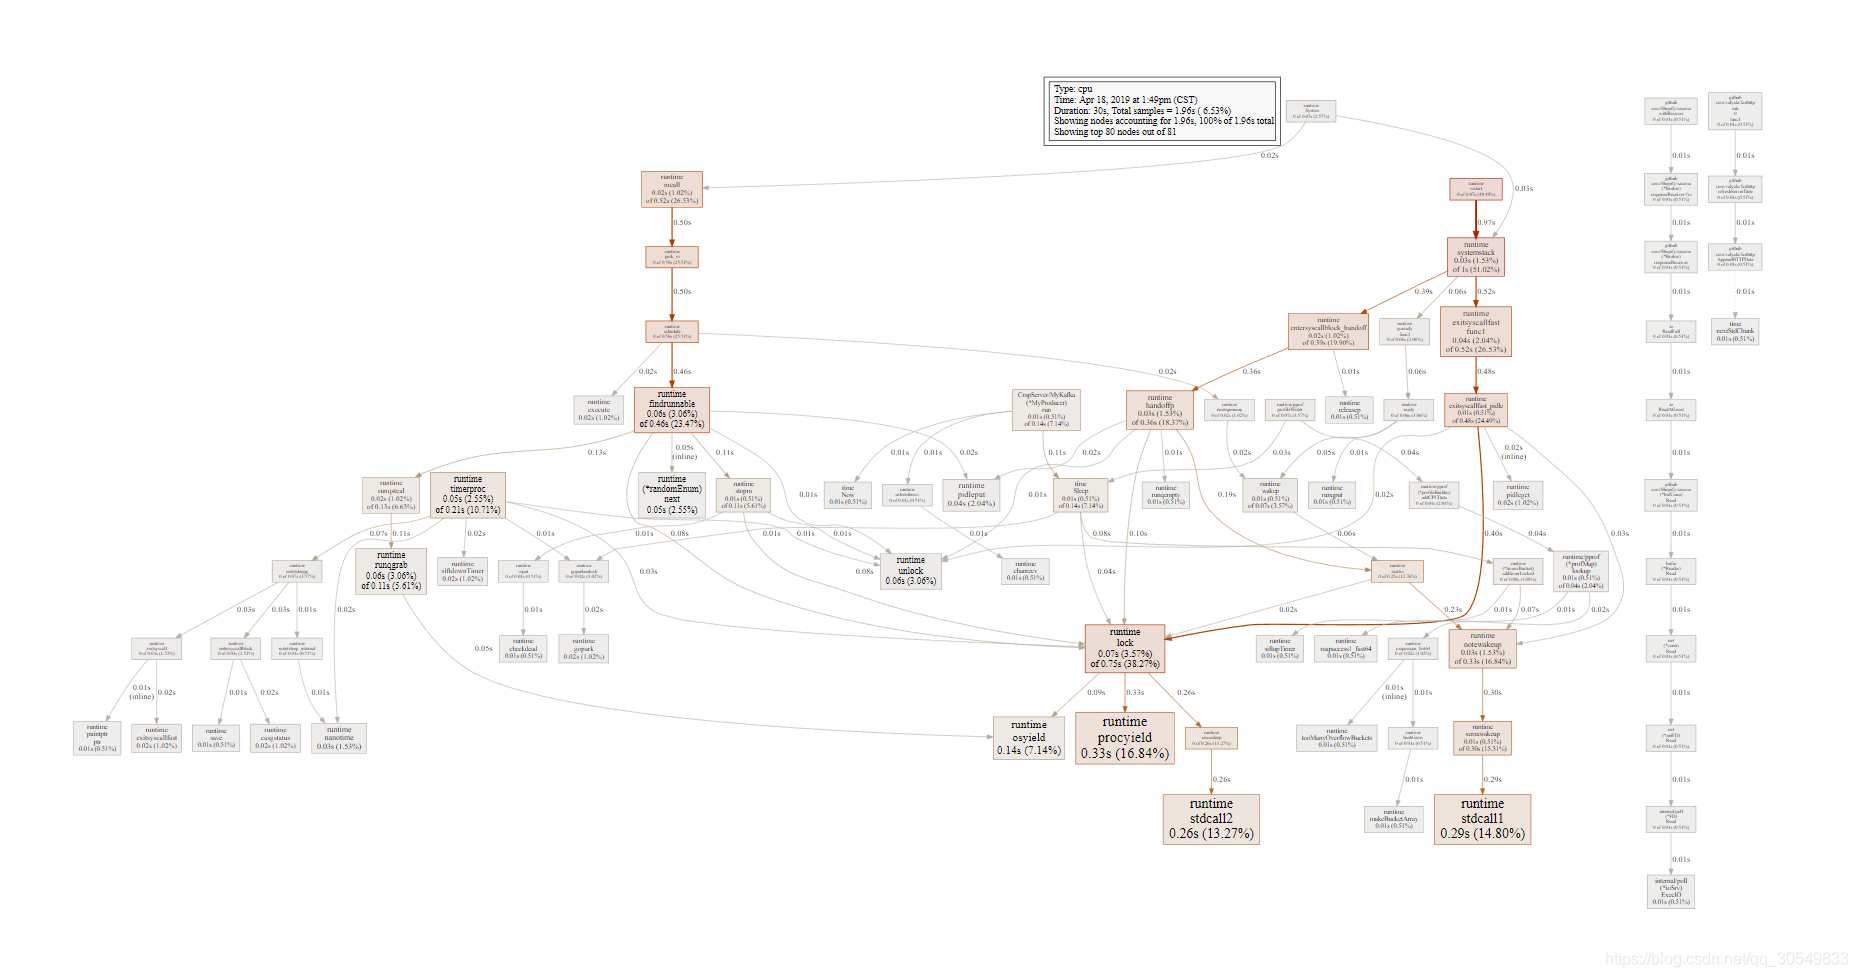
heap结果分析图: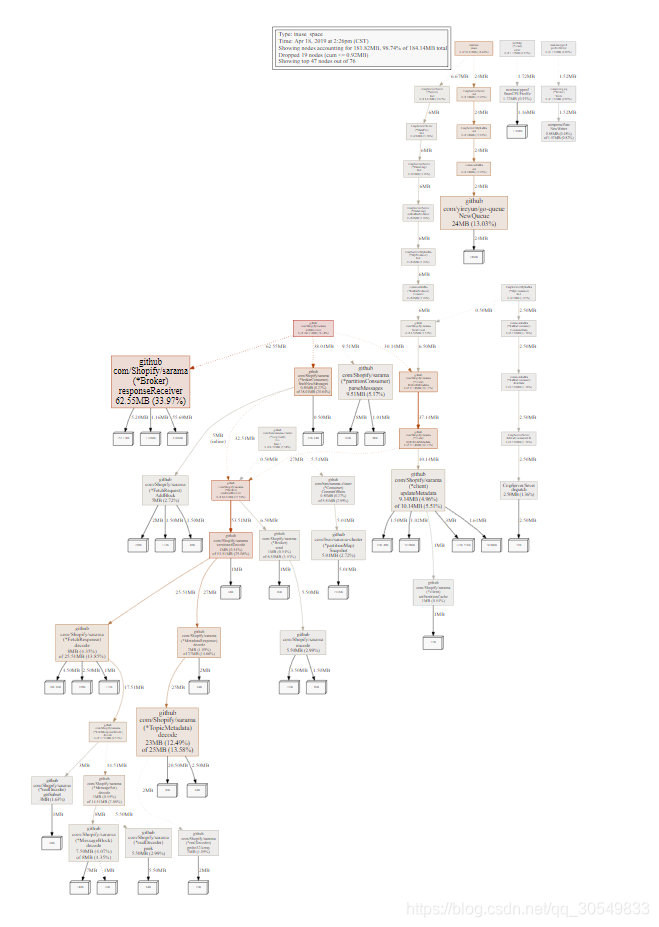
上面介绍了两种生成数据的方式:
1、在线生成
2、文件生成
文件生成的数据有trace.out、cpu.prof、 mem.prof、block.prof,trace.out 中包含了其余的三种,数据量比较大,分析起来比较复杂,其余的三种是单独的数据,查看起来比较直观。
trace.out所有的数据,内容较多,我们在 golang学习笔记-pprof性能分析2 单独分析
如果觉得我的文章对您有用,请随意打赏。你的支持将鼓励我继续创作!
