社区微信群开通啦,扫一扫抢先加入社区官方微信群

社区微信群
原文:Irate graphs are better graphs | Robust Perception
Prometheus 0.16.1 was just released, and with it brings my addition of the irate function. This offers more responsive graphs and higher resolution dashboards.
刚刚发布的普罗米修斯 0.16.1,新增了irate函数。它提供更好的响应界面(responsive graphs)和更高分辨率的面板(dashboards)。
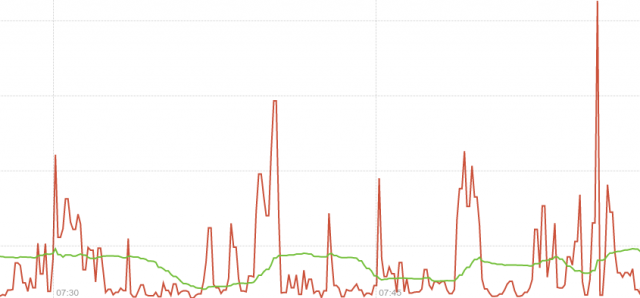
CPU usage on a machine. Red: irate(x[5m]). Green: rate(x[5m]).
电脑CPU使用率。红线:irate(x[5m])。绿线:rate(x[5m])。
The rate function takes a time series over a time range, and based on the first and last data points within that range (allowing for counter resets) calculates a per-second rate. As it’s based on the whole range, it’s effectively an average rate over that range – 5 minutes in this case. You can see that the green line in the graph above is slow to pick up on changes, and not showing the full detail.
rate函数在一个时间范围内构建时间序列,基于设定范围内的第一个和最后一个数据点来计算每秒比率(允许计数器重置),(last值-first值)/时间差。因为它是基于范围的,实际上它是某个范围的平均值 - 在本例是5分钟。在上图中,你可以看到绿线对数据的变化响应慢,而且没有显示详情。
By contrast irate is an instant rate. It only looks at the last two points within the range passed to it and calculates a per-second rate. In the graph above the scrape interval is 10 seconds, so the red line is allowing you to see much briefer spikes and finer detail. This gives you better insight into what’s really going on, taking advantage of the full resolution of the data available.
相比之下,irate是一个瞬时比率。 它只观测设定的范围内的最后两个点,并计算每秒的速率,(last值-last前一个值)/时间戳差值。在上图中,拉取间隔为10秒,那么红线看到更多的峰值和更详细的细节。这让你更好地了解实际情况,充分利用数据的全分辨率。
As with rate, irate is resilient to scrapes failing as it’ll look back to the previous successful scrape. This loses a little resolution, but you don’t miss any sudden changes around that failed scrape. This is one advantage of exporting raw counters over rates computed on the instrumented system.
和rate一样,irate碰到拉取数据失败是会取之前成功的数据。这样会损失一些精度,但是你不会错过那些失败的拉取数据。这是将原始计数器导出到在仪表化系统上计算的比率的一个优点。
Due to the instant rate being more responsive, there are a few things you should be aware of. If you’re doing alerting based on irate a very brief dip could reset the alert’s FOR clause, so prefer rate for alerting. In graphs over long time periods used for trending, full resolution data can be distracting so the implicit averaging of rate is more useful.
由于即时响应(instant rate)比较灵敏,你应该注意以下几点。如果基于irate配置告警,非常短暂的下降可能会使警报重设,因此最好使用rate作为告警条件。在用于长期趋势的图表中,完整的分辨率数据会分散注意力,所以隐式的平均比率更有用。
If irate only looks at the last two points, why do we pass it a much longer period than that? The answer is that you want to limit how far back it’ll look to find those two points, as you don’t want to inadvertently use data from hours ago. This also has the benefit that dashboards no longer need to consider all potential scrape intervals when choosing the rate range, often leading to averaging over a much longer period than is needed. With the instant rate if scrapes become more frequent, graphs automatically improve in resolution!
如果irate只需要最近两个点的数据,那为什么我们要传比这两个点长得多的时间范围呢?答案是,你想要限制这两点的取值范围,因为你不希望使用几个小时前的数据。还有另外一个好处,在面板(dashboards)选择比率范围(rate range)时,不需要考虑所有可能的拉取间隔(scrape intervals)。因为那样做通常会导致计算的时间比需要的长得多。如果拉取动作(scrape)变得更频繁,图像会自动提高分辨率。
如果觉得我的文章对您有用,请随意打赏。你的支持将鼓励我继续创作!
