社区微信群开通啦,扫一扫抢先加入社区官方微信群

社区微信群
介绍:
prometheus:开源监控系统,可参考博客prometheus的搭建与使用
node_exporter:服务器端agent,负责采集服务器基础监控项
grafana:一个开源的度量分析与可视化套件,常用于展示监控信息
安装:
安装node_exporter,启动后监听9100端口
wget https://github.com/prometheus/node_exporter/releases/download/v0.16.0-rc.3/node_exporter-0.16.0-rc.3.linux-amd64.tar.gz
tar -zxvf node_exporter-0.16.0-rc.3.linux-amd64.tar.gz
cd node_exporter-0.16.0-rc.3.linux-amd64
./node_exporter
安装grafana,启动后监听3000端口
yum install grafana
service grafana-server start
配置:
1、配置prometheus,修改prometheus.yml配置文件,增加安装node_exporter的机器,配置完成后重启
scrape_configs:
  # The job name is added as a label `job=<job_name>` to any timeseries scraped from this config.
  - job_name: 'node_exporter'

    # metrics_path defaults to '/metrics'
    # scheme defaults to 'http'.

    static_configs:
    - targets: ['localhost:9100']
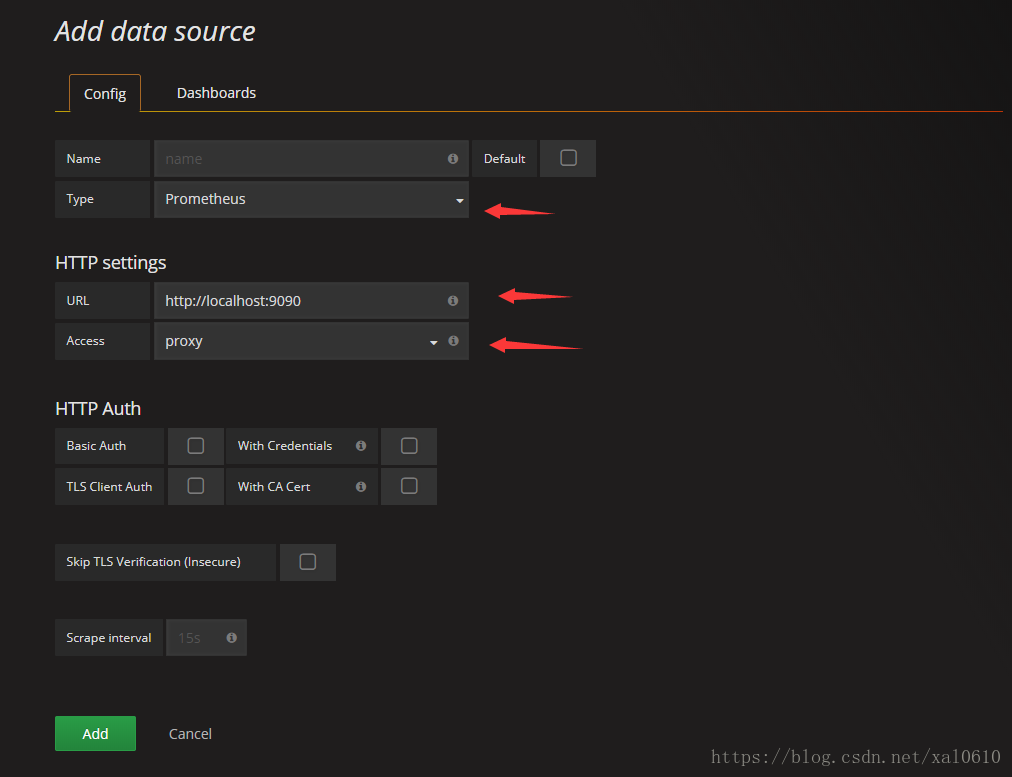
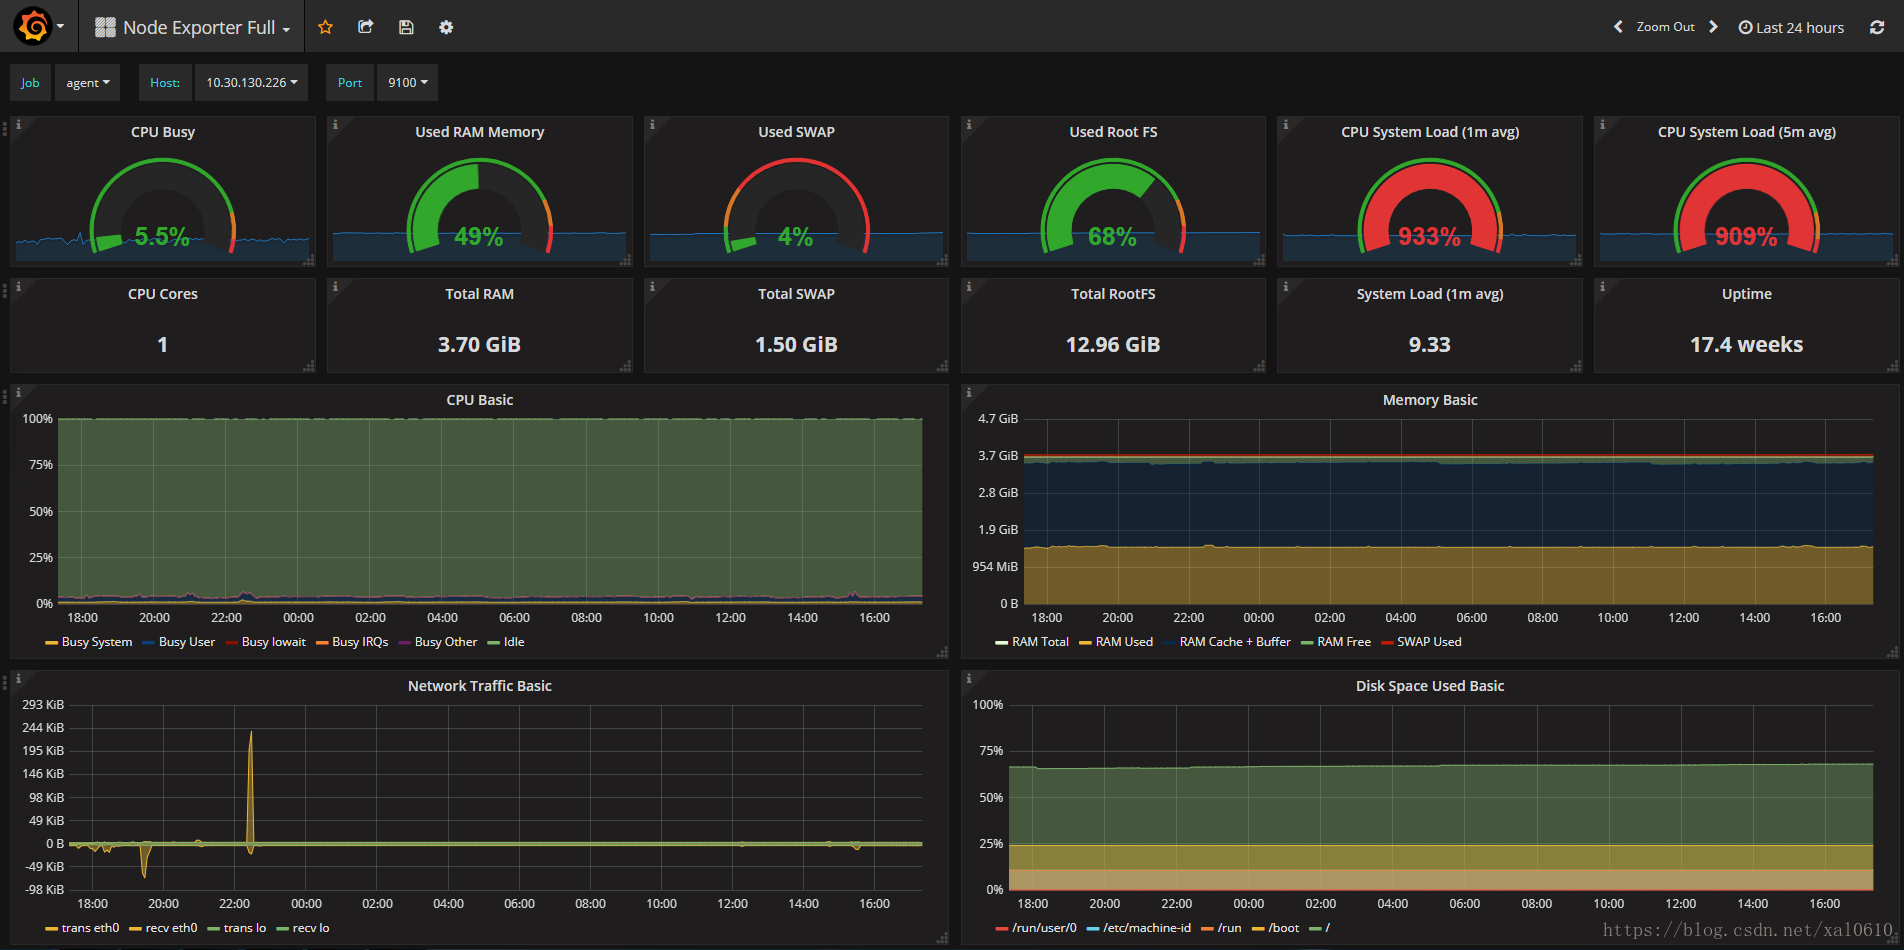
2、配置grafana增加data source,访问localhost:3000,推荐展示样式选择Node Exporter Full
效果:
如果觉得我的文章对您有用,请随意打赏。你的支持将鼓励我继续创作!