社区微信群开通啦,扫一扫抢先加入社区官方微信群

社区微信群
var labelSetting = {
normal: {
show: true,
position: 'right',
offset: [10, 0],
textStyle: {
fontSize: 16
}
}
};
var maxData=200000
var option = {
title: {
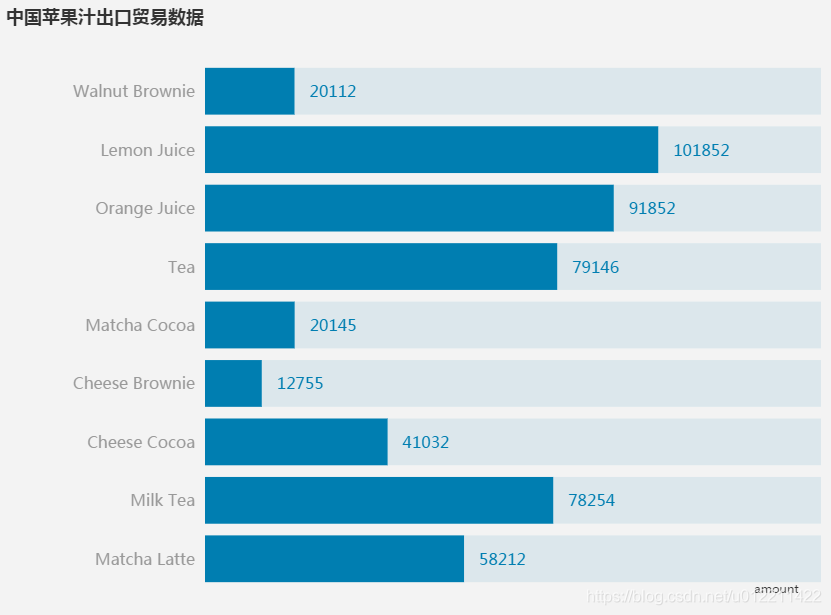
text: '中国苹果汁出口贸易数据'
},
dataset: {
source: [
['score', 'amount', 'product'],
[89.3, 58212, 'Matcha Latte'],
[57.1, 78254, 'Milk Tea'],
[74.4, 41032, 'Cheese Cocoa'],
[50.1, 12755, 'Cheese Brownie'],
[89.7, 20145, 'Matcha Cocoa'],
[68.1, 79146, 'Tea'],
[19.6, 91852, 'Orange Juice'],
[10.6, 101852, 'Lemon Juice'],
[32.7, 20112, 'Walnut Brownie']
]
},
grid: {containLabel: true},
xAxis: {name: 'amount',splitLine: {show: false},axisLine: {show: false},axisTick: {show: false}, axisLabel: {show: false},},
yAxis: {type: 'category',axisTick: {show: false},
axisLine: {show: false},
axisLabel: {
margin: 10,
textStyle: {
color: '#999',
fontSize: 16
}
}},
series: [
{
type: 'pictorialBar',
label: labelSetting,
symbol: 'rect',
itemStyle: {
normal: {
color: '#007eb1',
}
},
encode: {
// Map the "amount" column to X axis.
x: 'amount',
// Map the "product" column to Y axis
y: 'product'
},
z:10
},
{
// full data
type: 'pictorialBar',
itemStyle: {
normal: {
color: '#7dbad2',
opacity: 0.2
}
},
/* symbolRepeat: 'fixed',*/
/* symbolMargin: '5%',
*/ symbol: 'rect',
/* symbolSize: 30,*/
symbolBoundingData: maxData,
encode: {
// Map the "amount" column to X axis.
x: 'amount',
// Map the "product" column to Y axis
y: 'product'
},
z: 5
}
]
};
效果展示图:
如果觉得我的文章对您有用,请随意打赏。你的支持将鼓励我继续创作!
