社区微信群开通啦,扫一扫抢先加入社区官方微信群

社区微信群
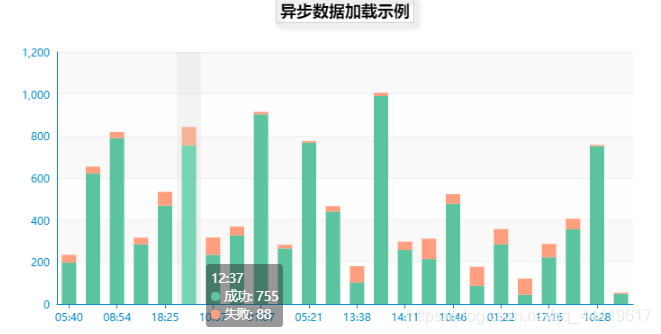
1.设置其它的样式,显示一个空的直角坐标轴
2.获取数据
3.填入数据
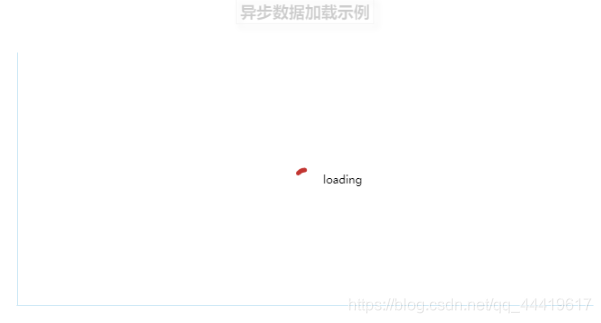
1.调用 showLoading 方法显示加载动画
2.数据加载完成
3.调用 hideLoading 方法隐藏加载动画
<template>
  <div style="width: 800px;height:400px;"/>
</template>

<script>
import echarts from 'echarts'
import {getData} from '@/api/barchart'
require('echarts/theme/macarons')

export default {
  data() {
    return {
      loading: true
    }
  },
  mounted() {
    this.$nextTick(() => {
      this.initChart()
    })
  },
  created() {
    this.fetchData()
  },
  methods: {
    fetchData() { // 异步加载数据
      this.loading = true
      getData().then(response => {
        this.chart.hideLoading()
        // 填入数据
        this.chart.setOption({
          xAxis: {
            data: response.history.time
          },
          series: [{
            // 根据名字对应到相应的系列
            name: '成功',
            data: response.history.success
          },
          {
            // 根据名字对应到相应的系列
            name: '失败',
            data: response.history.fail
          }]
        })
        this.loading = false
      }).catch(() => {
        this.loading = false
      })
    },
    initChart() {
      this.chart = echarts.init(this.$el, 'macarons')
      this.chart.setOption({ // 显示标题,图例和空的坐标轴
        title: {
          show: true,
          text: '异步数据加载示例',
          textStyle: {
            color: '#000',
            fontWeight: 'bolder'
          },
          left: 'center',
          top: 'top',
          borderWidth: 1,
          shadowColor: 'rgba(0, 0, 0, 0.5)',
          shadowBlur: 9,
          shadowOffsetX: 4,
          shadowOffsetY: 4
        },
        tooltip: {
          trigger: 'axis',
          axisPointer: {
            type: 'shadow'
          }
        },
        xAxis: [{
          type: 'category',
          data: [],
          axisTick: {
            alignWithLabel: true
          }
        }],
        yAxis: [{
          type: 'value',
          axisTick: {
            show: false
          }
        }],
        series: [{
          name: '成功',
          type: 'bar',
          stack: 'vistors',
          barWidth: '60%',
          data: []
        }, {
          name: '失败',
          type: 'bar',
          stack: 'vistors',
          barWidth: '60%',
          data: []
        }],
        color: [
          '#5bc49f',
          '#FF9F7F'
        ]
      })
      this.chart.showLoading()
    }
  }
}
</script>
参考:异步数据加载和更新
如果觉得我的文章对您有用,请随意打赏。你的支持将鼓励我继续创作!
