LineDataSet dataSet = new LineDataSet(entries, "Label"); // add entries to dataset
dataSet.setColor(...);
dataSet.setValueTextColor(...); // styling, ...
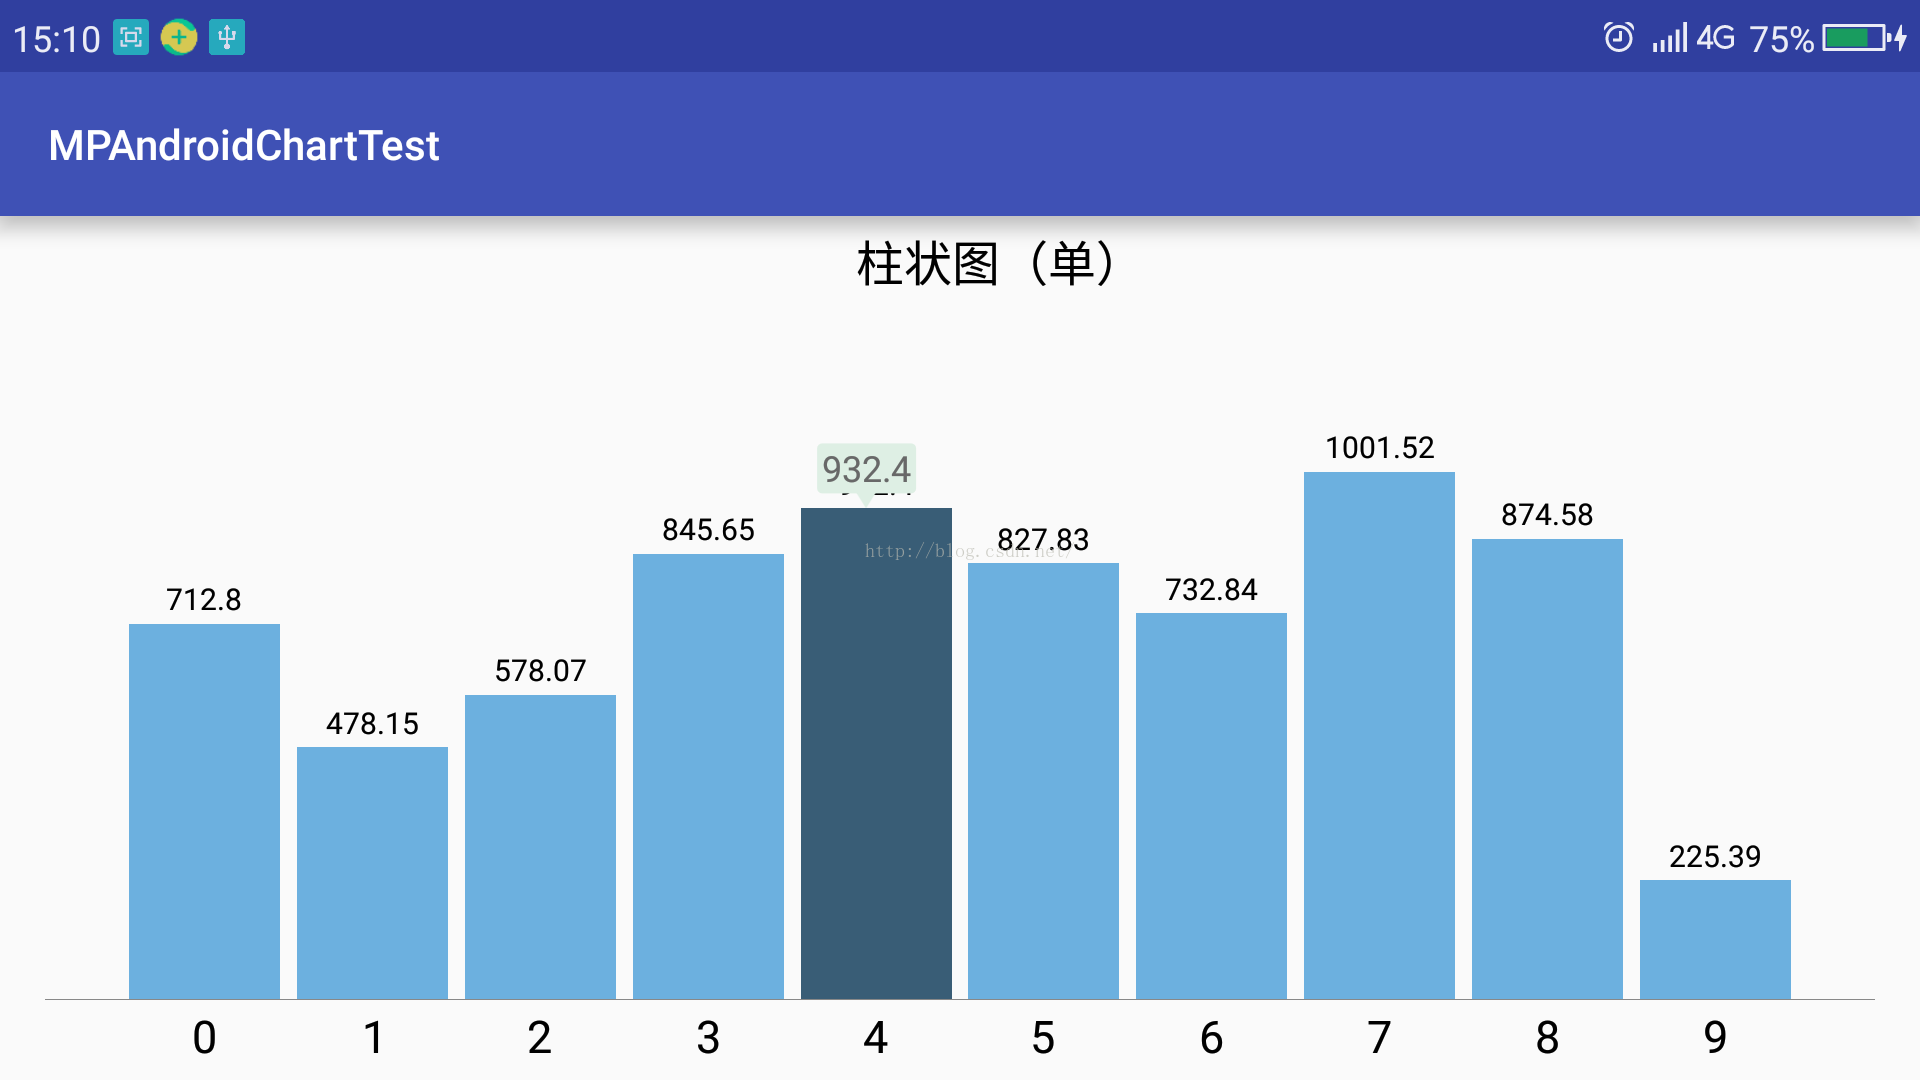
1、单柱图:
先看效果图,如下:
布局如下:
<?xml version="1.0" encoding="utf-8"?>
<RelativeLayout xmlns:android="http://schemas.android.com/apk/res/android"
xmlns:tools="http://schemas.android.com/tools"
android:id="@+id/activity_bar_chart"
android:layout_width="match_parent"
android:layout_height="match_parent"
tools:context="com.charlie.mpandroidcharttest.chartactivity.BarChartActivity">
<com.github.mikephil.charting.charts.BarChart
android:id="@+id/barChart1"
android:layout_width="match_parent"
android:layout_height="match_parent"/>
</RelativeLayout>
设置好x轴和y轴要显示的数据,然后调用如下函数即可:
/**
* 单数据集。设置柱状图样式,X轴为字符串,Y轴为数值
*
* @param barChart
* @param xAxisValue
* @param yAxisValue
* @param title 图例文字
* @param xAxisTextSize x轴标签字体大小
* @param barColor
*/
public static void setBarChart(BarChart barChart, List<String> xAxisValue, List<Float> yAxisValue, String title, float xAxisTextSize, Integer barColor) {
barChart.getDescription().setEnabled(false);//设置描述
barChart.setPinchZoom(true);//设置按比例放缩柱状图
//设置自定义的markerView
MPChartMarkerView markerView = new MPChartMarkerView(barChart.getContext(), R.layout.custom_marker_view);
barChart.setMarker(markerView);
//x坐标轴设置
IAxisValueFormatter xAxisFormatter = new StringAxisValueFormatter(xAxisValue);//设置自定义的x轴值格式化器
XAxis xAxis = barChart.getXAxis();//获取x轴
xAxis.setPosition(XAxis.XAxisPosition.BOTTOM);//设置X轴标签显示位置
xAxis.setDrawGridLines(false);//不绘制格网线
xAxis.setGranularity(1f);//设置最小间隔,防止当放大时,出现重复标签。
xAxis.setValueFormatter(xAxisFormatter);
xAxis.setTextSize(xAxisTextSize);//设置标签字体大小
xAxis.setLabelCount(xAxisValue.size());//设置标签显示的个数
//y轴设置
YAxis leftAxis = barChart.getAxisLeft();//获取左侧y轴
leftAxis.setPosition(YAxis.YAxisLabelPosition.OUTSIDE_CHART);//设置y轴标签显示在外侧
leftAxis.setAxisMinimum(0f);//设置Y轴最小值
leftAxis.setDrawGridLines(false);
leftAxis.setDrawLabels(false);//禁止绘制y轴标签
leftAxis.setDrawAxisLine(false);//禁止绘制y轴
barChart.getAxisRight().setEnabled(false);//禁用右侧y轴
//图例设置
Legend legend = barChart.getLegend();
legend.setHorizontalAlignment(Legend.LegendHorizontalAlignment.CENTER);//图例水平居中
legend.setVerticalAlignment(Legend.LegendVerticalAlignment.TOP);//图例在图表上方
legend.setOrientation(Legend.LegendOrientation.HORIZONTAL);//图例的方向为水平
legend.setDrawInside(false);//绘制在chart的外侧
legend.setDirection(Legend.LegendDirection.LEFT_TO_RIGHT);//图例中的文字方向
legend.setForm(Legend.LegendForm.SQUARE);//图例窗体的形状
legend.setFormSize(0f);//图例窗体的大小
legend.setTextSize(16f);//图例文字的大小
//legend.setYOffset(-2f);
//设置柱状图数据
setBarChartData(barChart, yAxisValue, title, barColor);
barChart.setExtraBottomOffset(10);//距视图窗口底部的偏移,类似与paddingbottom
barChart.setExtraTopOffset(30);//距视图窗口顶部的偏移,类似与paddingtop
barChart.setFitBars(true);//使两侧的柱图完全显示
barChart.animateX(1500);//数据显示动画,从左往右依次显示
}
/**
* 设置柱图
*
* @param barChart
* @param yAxisValue
* @param title
* @param barColor
*/
private static void setBarChartData(BarChart barChart, List<Float> yAxisValue, String title, Integer barColor) {
ArrayList<BarEntry> entries = new ArrayList<>();
for (int i = 0, n = yAxisValue.size(); i < n; ++i) {
entries.add(new BarEntry(i, yAxisValue.get(i)));
}
BarDataSet set1;
if (barChart.getData() != null && barChart.getData().getDataSetCount() > 0) {
set1 = (BarDataSet) barChart.getData().getDataSetByIndex(0);
set1.setValues(entries);
barChart.getData().notifyDataChanged();
barChart.notifyDataSetChanged();
} else {
set1 = new BarDataSet(entries, title);
if (barColor == null) {
set1.setColor(ContextCompat.getColor(barChart.getContext(), R.color.bar));//设置set1的柱的颜色
} else {
set1.setColor(barColor);
}
ArrayList<IBarDataSet> dataSets = new ArrayList<>();
dataSets.add(set1);
BarData data = new BarData(dataSets);
data.setValueTextSize(10f);
data.setBarWidth(0.9f);
data.setValueFormatter(new MyValueFormatter());
barChart.setData(data);
}
}
自定义MPChartMarkerView的代码如下:
package com.charlie.mpandroidcharttest.common;
import android.content.Context;
import com.charlie.mpandroidcharttest.R;
import com.charlie.mpandroidcharttest.util.StringUtils;
import com.github.mikephil.charting.components.MarkerView;
import com.github.mikephil.charting.data.CandleEntry;
import com.github.mikephil.charting.data.Entry;
import com.github.mikephil.charting.highlight.Highlight;
import com.github.mikephil.charting.utils.MPPointF;
/**
* Created by JKWANG-PC on 2016/11/1.
*
* Since release v3.0.0, markers (popup views) in the chart are represented by the IMarker interface.
*/
public class MPChartMarkerView extends MarkerView {
private ArrowTextView tvContent;
/**
* Constructor. Sets up the MarkerView with a custom layout resource.
*
* @param context
* @param layoutResource the layout resource to use for the MarkerView
*/
public MPChartMarkerView(Context context, int layoutResource) {
super(context, layoutResource);
tvContent = (ArrowTextView) findViewById(R.id.tvContent);
}
@Override
public void refreshContent(Entry e, Highlight highlight) {
if (e instanceof CandleEntry) {
CandleEntry ce = (CandleEntry) e;
tvContent.setText(StringUtils.double2String(ce.getHigh(), 2));
} else {
tvContent.setText(StringUtils.double2String(e.getY(), 2));
}
super.refreshContent(e, highlight);//必须加上该句话;This sentence must be added.
}
private MPPointF mOffset;
@Override
public MPPointF getOffset() {
if(mOffset == null) {
// center the marker horizontally and vertically
mOffset = new MPPointF(-(getWidth() / 2), -getHeight());
}
return mOffset;
}
}
自定义ArrowTextView的代码如下:
package com.charlie.mpandroidcharttest.common;
import android.content.Context;
import android.content.res.TypedArray;
import android.graphics.Canvas;
import android.graphics.Color;
import android.graphics.Paint;
import android.graphics.Path;
import android.graphics.RectF;
import android.util.AttributeSet;
import android.util.TypedValue;
import android.widget.TextView;
import com.charlie.mpandroidcharttest.R;
/**
* Created by JKWANG-PC on 2016/11/1.
* 带下箭头的文本框。
*/
public class ArrowTextView extends TextView {
private float radius;
private float arrowWidth;
private float arrowHeight;
private int color;
public ArrowTextView(Context context, AttributeSet attrs) {
super(context, attrs);
ini(context, attrs);
}
private void ini(Context context, AttributeSet attrs) {
TypedArray typedArray = context.obtainStyledAttributes(attrs, R.styleable.ArrowTextView);
radius = typedArray.getDimension(R.styleable.ArrowTextView_radius, 0);
arrowWidth = typedArray.getDimension(R.styleable.ArrowTextView_arrowWidth, 0);
arrowHeight = typedArray.getDimension(R.styleable.ArrowTextView_arrowHeight, 0);
color = typedArray.getColor(R.styleable.ArrowTextView_bg, Color.RED);
}
public ArrowTextView(Context context, AttributeSet attrs, int defStyle) {
super(context, attrs, defStyle);
ini(context, attrs);
}
public ArrowTextView(Context context) {
super(context);
}
/**
* @param arrowWidth 三角形箭头的宽度.......
*/
public void setArrowWidth(float arrowWidth) {
this.arrowWidth = arrowWidth;
invalidate();
}
/**
* @param arrowHeight 三角形箭头的高度......
*/
public void setArrowHeight(float arrowHeight) {
this.arrowHeight = arrowHeight;
invalidate();
}
/**
* @param radius 矩形四角圆角的半径..........
*/
public void setRadius(float radius) {
this.radius = radius;
invalidate();
}
/**
* @param color 箭头矩形的背景色.........
*/
public void setBgColor(int color) {
this.color = color;
invalidate();
}
@Override
protected void onDraw(Canvas canvas) {
Paint paint = new Paint();
paint.setColor(color == 0 ? Color.RED : color);
paint.setAntiAlias(true);
if (radius == 0) {
radius = TypedValue.applyDimension(TypedValue.COMPLEX_UNIT_PX, 5, getResources().getDisplayMetrics());
}
if (arrowWidth == 0) {
arrowWidth = TypedValue.applyDimension(TypedValue.COMPLEX_UNIT_PX, 20, getResources().getDisplayMetrics());
}
if (arrowHeight == 0) {
arrowHeight = TypedValue.applyDimension(TypedValue.COMPLEX_UNIT_PX, 15, getResources().getDisplayMetrics());
}
//带圆角的矩形(下边减去三角形的高度...........)
int width = getWidth();
Float height = getHeight() - arrowHeight;
canvas.drawRoundRect(new RectF(0, 0, getWidth(), height), radius, radius, paint);
//画三角形
Path path = new Path();
path.setFillType(Path.FillType.EVEN_ODD);
float xMiddle = width / 2;
float xLeft = xMiddle - arrowWidth / 2;
float xRight = xMiddle + arrowWidth / 2;
float yBottom = height + arrowHeight;
path.moveTo(xMiddle, yBottom);
path.lineTo(xLeft, height-1);
path.lineTo(xRight, height-1);
path.lineTo(xMiddle, yBottom);
path.close();
canvas.drawPath(path, paint);
// canvas.restore();
// canvas.translate(left, 0);
super.onDraw(canvas);
}
}
attrs.xml内容如下:
<?xml version="1.0" encoding="utf-8"?>
<resources>
<declare-styleable name="ArrowTextView">
<attr name="radius" format="dimension" />
<attr name="arrowWidth" format="dimension" />
<attr name="arrowHeight" format="dimension" />
<attr name="bg" format="color" />
</declare-styleable>
</resources>
colors.xml内容如下:
<?xml version="1.0" encoding="utf-8"?>
<resources>
<color name="bar">#6CB0DF</color>
<color name="bar1">#B5C2CA</color>
<color name="bar2">#F5E6BF</color>
<color name="bar3">#81D8C8</color>
<color name="description">#686868</color>
<color name="line">#8CD276</color>
<color name="linefill">#DEEFE4</color>
<color name="line1">#E9C517</color>
<color name="line1fill">#ECEAD0</color>
<color name="line2">#9F8FBA</color>
<color name="line2fill">#EBE4F8</color>
</resources>
custom_marker_view.xml布局文件如下:
<?xml version="1.0" encoding="utf-8"?>
<LinearLayout xmlns:android="http://schemas.android.com/apk/res/android"
xmlns:app="http://schemas.android.com/apk/res-auto"
android:orientation="vertical"
android:layout_width="wrap_content"
android:layout_height="wrap_content">
<com.charlie.mpandroidcharttest.common.ArrowTextView
android:id="@+id/tvContent"
android:layout_width="wrap_content"
android:layout_height="wrap_content"
android:gravity="center"
android:paddingBottom="16px"
android:paddingRight="5px"
android:paddingLeft="5px"
android:text=""
android:textSize="36px"
android:textColor="@color/description"
android:maxLines="1"
android:ellipsize="end"
app:bg="@color/linefill"
app:radius="5px"/>
</LinearLayout>
MyValueFormatter.java定义如下:
package com.charlie.mpandroidcharttest.common;
import com.charlie.mpandroidcharttest.util.StringUtils;
import com.github.mikephil.charting.data.Entry;
import com.github.mikephil.charting.formatter.IValueFormatter;
import com.github.mikephil.charting.utils.ViewPortHandler;
/**
* Created by JKWANG-PC on 2016/11/21.
*/
public class MyValueFormatter implements IValueFormatter {
@Override
public String getFormattedValue(float value, Entry entry, int dataSetIndex, ViewPortHandler viewPortHandler) {
return StringUtils.double2String(value, 2);
}
}
StringAxisValueFormatter.java定义如下:
package com.charlie.mpandroidcharttest.common;
import com.github.mikephil.charting.components.AxisBase;
import com.github.mikephil.charting.formatter.IAxisValueFormatter;
import java.util.List;
/**
* Created by Charlie on 2016/9/23.
* 对字符串类型的坐标轴标记进行格式化
*/
public class StringAxisValueFormatter implements IAxisValueFormatter {
//区域值
private List<String> mStrs;
/**
* 对字符串类型的坐标轴标记进行格式化
* @param strs
*/
public StringAxisValueFormatter(List<String> strs){
this.mStrs =strs;
}
@Override
public String getFormattedValue(float v, AxisBase axisBase) {
return mStrs.get((int)v);
}
}
StringUtils.java定义如下:
package com.charlie.mpandroidcharttest.util;
import java.text.NumberFormat;
/**
* Created by Charlie on 2016/10/8.
* 通用字符串管理类
*/
public class StringUtils {
/**
* 将double转为数值,并最多保留num位小数。例如当num为2时,1.268为1.27,1.2仍为1.2;1仍为1,而非1.00;100.00则返回100。
*
* @param d
* @param num 小数位数
* @return
*/
public static String double2String(double d, int num) {
NumberFormat nf = NumberFormat.getNumberInstance();
nf.setMaximumFractionDigits(num);//保留两位小数
nf.setGroupingUsed(false);//去掉数值中的千位分隔符
String temp = nf.format(d);
if (temp.contains(".")) {
String s1 = temp.split("\.")[0];
String s2 = temp.split("\.")[1];
for (int i = s2.length(); i > 0; --i) {
if (!s2.substring(i - 1, i).equals("0")) {
return s1 + "." + s2.substring(0, i);
}
}
return s1;
}
return temp;
}
/**
* 将double转为数值,并最多保留num位小数。
*
* @param d
* @param num 小数个数
* @param defValue 默认值。当d为null时,返回该值。
* @return
*/
public static String double2String(Double d, int num, String defValue){
if(d==null){
return defValue;
}
return double2String(d,num);
}
}
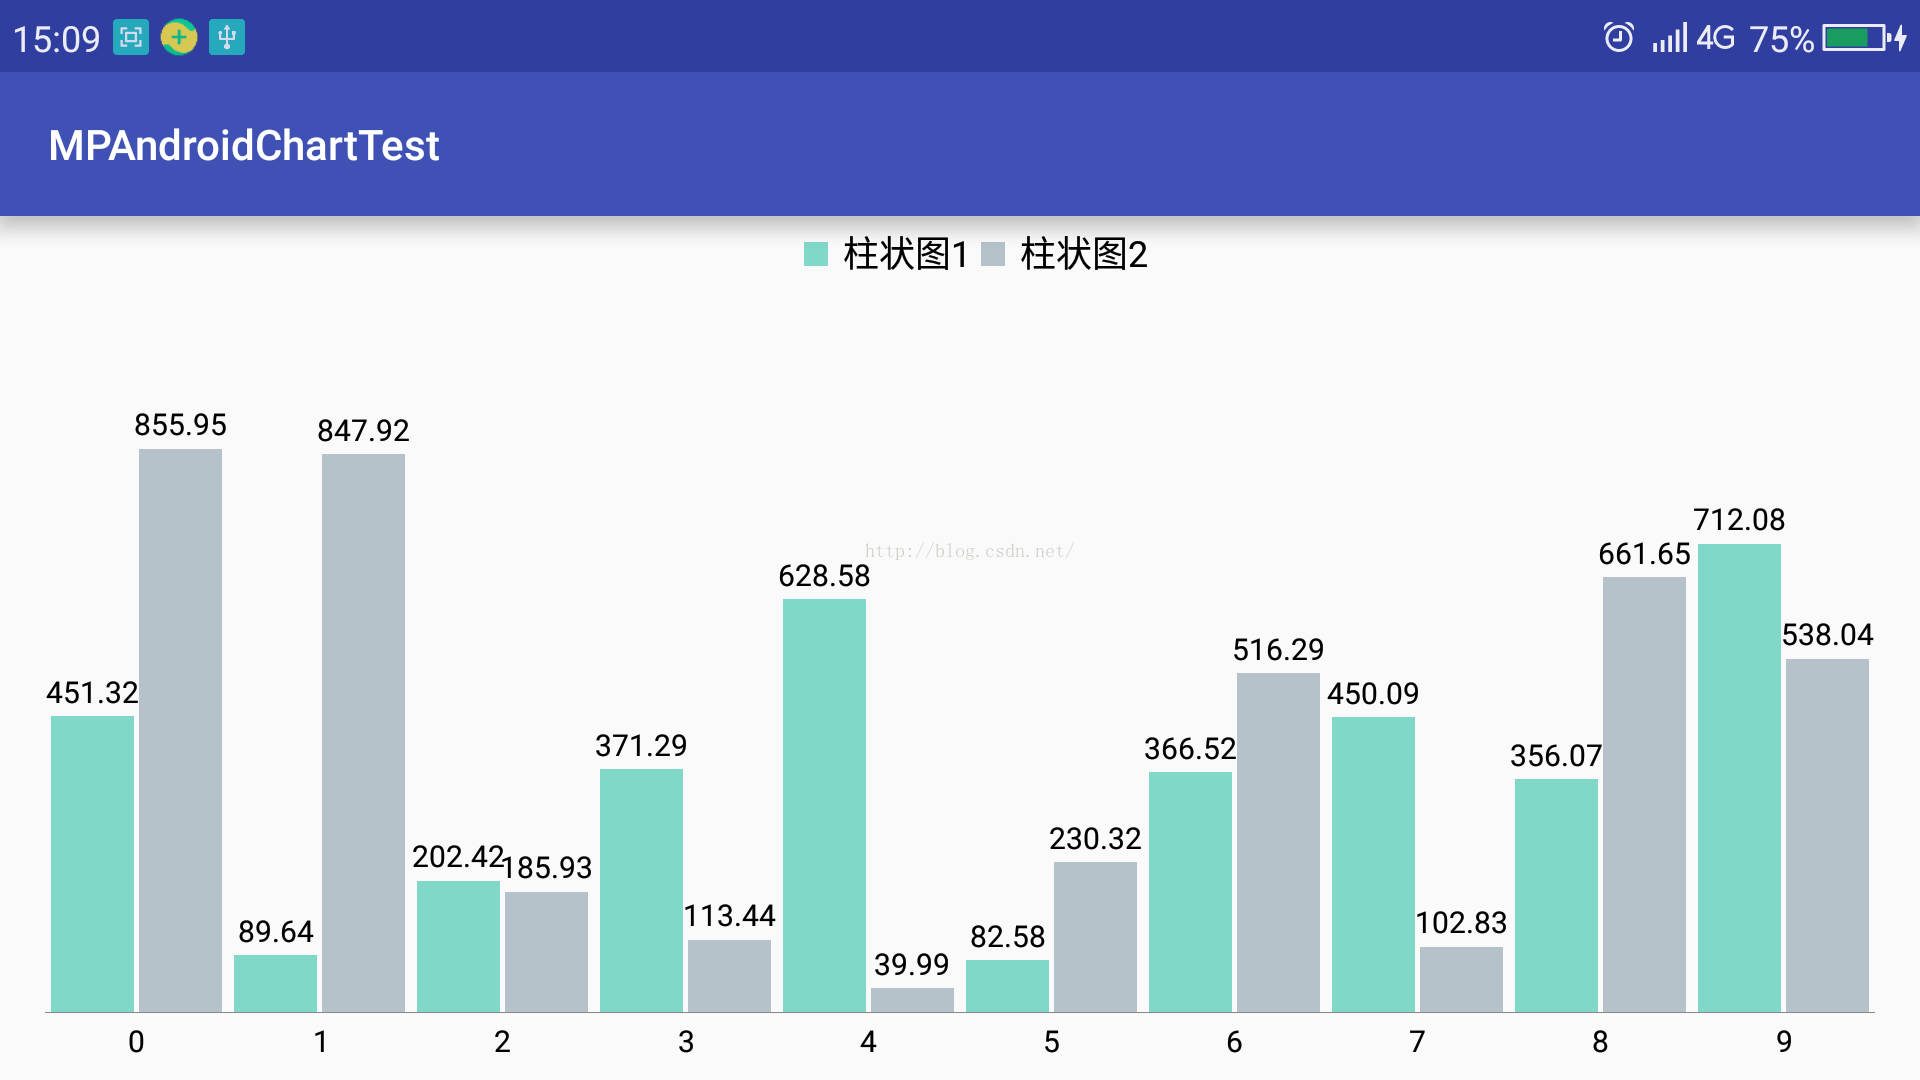
2、双柱图:
先看效果图,如下:
布局同1单柱图。设置好x轴和y轴要显示的数据,然后调用如下函数即可:
/**
* 设置双柱状图样式
*
* @param barChart
* @param xAxisValue
* @param yAxisValue1
* @param yAxisValue2
* @param bartilte1
* @param bartitle2
*/
public static void setTwoBarChart(BarChart barChart, List<Integer> xAxisValue, List<Float> yAxisValue1, List<Float> yAxisValue2, String bartilte1, String bartitle2) {
barChart.getDescription().setEnabled(false);//设置描述
barChart.setPinchZoom(true);//设置按比例放缩柱状图
barChart.setExtraBottomOffset(10);
barChart.setExtraTopOffset(30);
MPChartMarkerView markerView = new MPChartMarkerView(barChart.getContext(), R.layout.custom_marker_view);
barChart.setMarker(markerView);
//x坐标轴设置
XAxis xAxis = barChart.getXAxis();
xAxis.setPosition(XAxis.XAxisPosition.BOTTOM);
xAxis.setDrawGridLines(false);
xAxis.setGranularity(1f);
xAxis.setLabelCount(xAxisValue.size());
xAxis.setCenterAxisLabels(true);//设置标签居中
xAxis.setValueFormatter(new IAxisValueFormatter() {
@Override
public String getFormattedValue(float v, AxisBase axisBase) {
return String.valueOf((int) v);
}
});
//y轴设置
YAxis leftAxis = barChart.getAxisLeft();
leftAxis.setPosition(YAxis.YAxisLabelPosition.OUTSIDE_CHART);
leftAxis.setDrawGridLines(false);
leftAxis.setDrawLabels(false);
leftAxis.setDrawAxisLine(false);
//设置坐标轴最大最小值
Float yMin1 = Collections.min(yAxisValue1);
Float yMin2 = Collections.min(yAxisValue2);
Float yMax1 = Collections.max(yAxisValue1);
Float yMax2 = Collections.max(yAxisValue2);
Float yMin = Double.valueOf((yMin1 < yMin2 ? yMin1 : yMin2) * 0.1).floatValue();
Float yMax = Double.valueOf((yMax1 > yMax2 ? yMax1 : yMax2) * 1.1).floatValue();
leftAxis.setAxisMaximum(yMax);
leftAxis.setAxisMinimum(yMin);
barChart.getAxisRight().setEnabled(false);
//图例设置
Legend legend = barChart.getLegend();
legend.setHorizontalAlignment(Legend.LegendHorizontalAlignment.CENTER);
legend.setVerticalAlignment(Legend.LegendVerticalAlignment.TOP);
legend.setOrientation(Legend.LegendOrientation.HORIZONTAL);
legend.setDrawInside(false);
legend.setDirection(Legend.LegendDirection.LEFT_TO_RIGHT);
legend.setForm(Legend.LegendForm.SQUARE);
legend.setTextSize(12f);
//设置柱状图数据
setTwoBarChartData(barChart, xAxisValue, yAxisValue1, yAxisValue2, bartilte1, bartitle2);
barChart.animateX(1500);//数据显示动画,从左往右依次显示
barChart.invalidate();
}
/**
* 设置柱状图数据源
*/
private static void setTwoBarChartData(BarChart barChart, List<Integer> xAxisValue, List<Float> yAxisValue1, List<Float> yAxisValue2, String bartilte1, String bartitle2) {
float groupSpace = 0.04f;
float barSpace = 0.03f;
float barWidth = 0.45f;
// (0.45 + 0.03) * 2 + 0.04 = 1,即一个间隔为一组,包含两个柱图 -> interval per "group"
ArrayList<BarEntry> entries1 = new ArrayList<>();
ArrayList<BarEntry> entries2 = new ArrayList<>();
for (int i = 0, n = yAxisValue1.size(); i < n; ++i) {
entries1.add(new BarEntry(xAxisValue.get(i), yAxisValue1.get(i)));
entries2.add(new BarEntry(xAxisValue.get(i), yAxisValue2.get(i)));
}
BarDataSet dataset1, dataset2;
if (barChart.getData() != null && barChart.getData().getDataSetCount() > 0) {
dataset1 = (BarDataSet) barChart.getData().getDataSetByIndex(0);
dataset2 = (BarDataSet) barChart.getData().getDataSetByIndex(1);
dataset1.setValues(entries1);
dataset2.setValues(entries2);
barChart.getData().notifyDataChanged();
barChart.notifyDataSetChanged();
} else {
dataset1 = new BarDataSet(entries1, bartilte1);
dataset2 = new BarDataSet(entries2, bartitle2);
dataset1.setColor(Color.rgb(129, 216, 200));
dataset2.setColor(Color.rgb(181, 194, 202));
ArrayList<IBarDataSet> dataSets = new ArrayList<>();
dataSets.add(dataset1);
dataSets.add(dataset2);
BarData data = new BarData(dataSets);
data.setValueTextSize(10f);
data.setBarWidth(0.9f);
data.setValueFormatter(new IValueFormatter() {
@Override
public String getFormattedValue(float value, Entry entry, int i, ViewPortHandler viewPortHandler) {
return StringUtils.double2String(value, 2);
}
});
barChart.setData(data);
}
barChart.getBarData().setBarWidth(barWidth);
barChart.getXAxis().setAxisMinimum(xAxisValue.get(0));
// barData.getGroupWith(...) is a helper that calculates the width each group needs based on the provided parameters
barChart.getXAxis().setAxisMaximum(barChart.getBarData().getGroupWidth(groupSpace, barSpace) * xAxisValue.size() + xAxisValue.get(0));
barChart.groupBars(xAxisValue.get(0), groupSpace, barSpace);
}
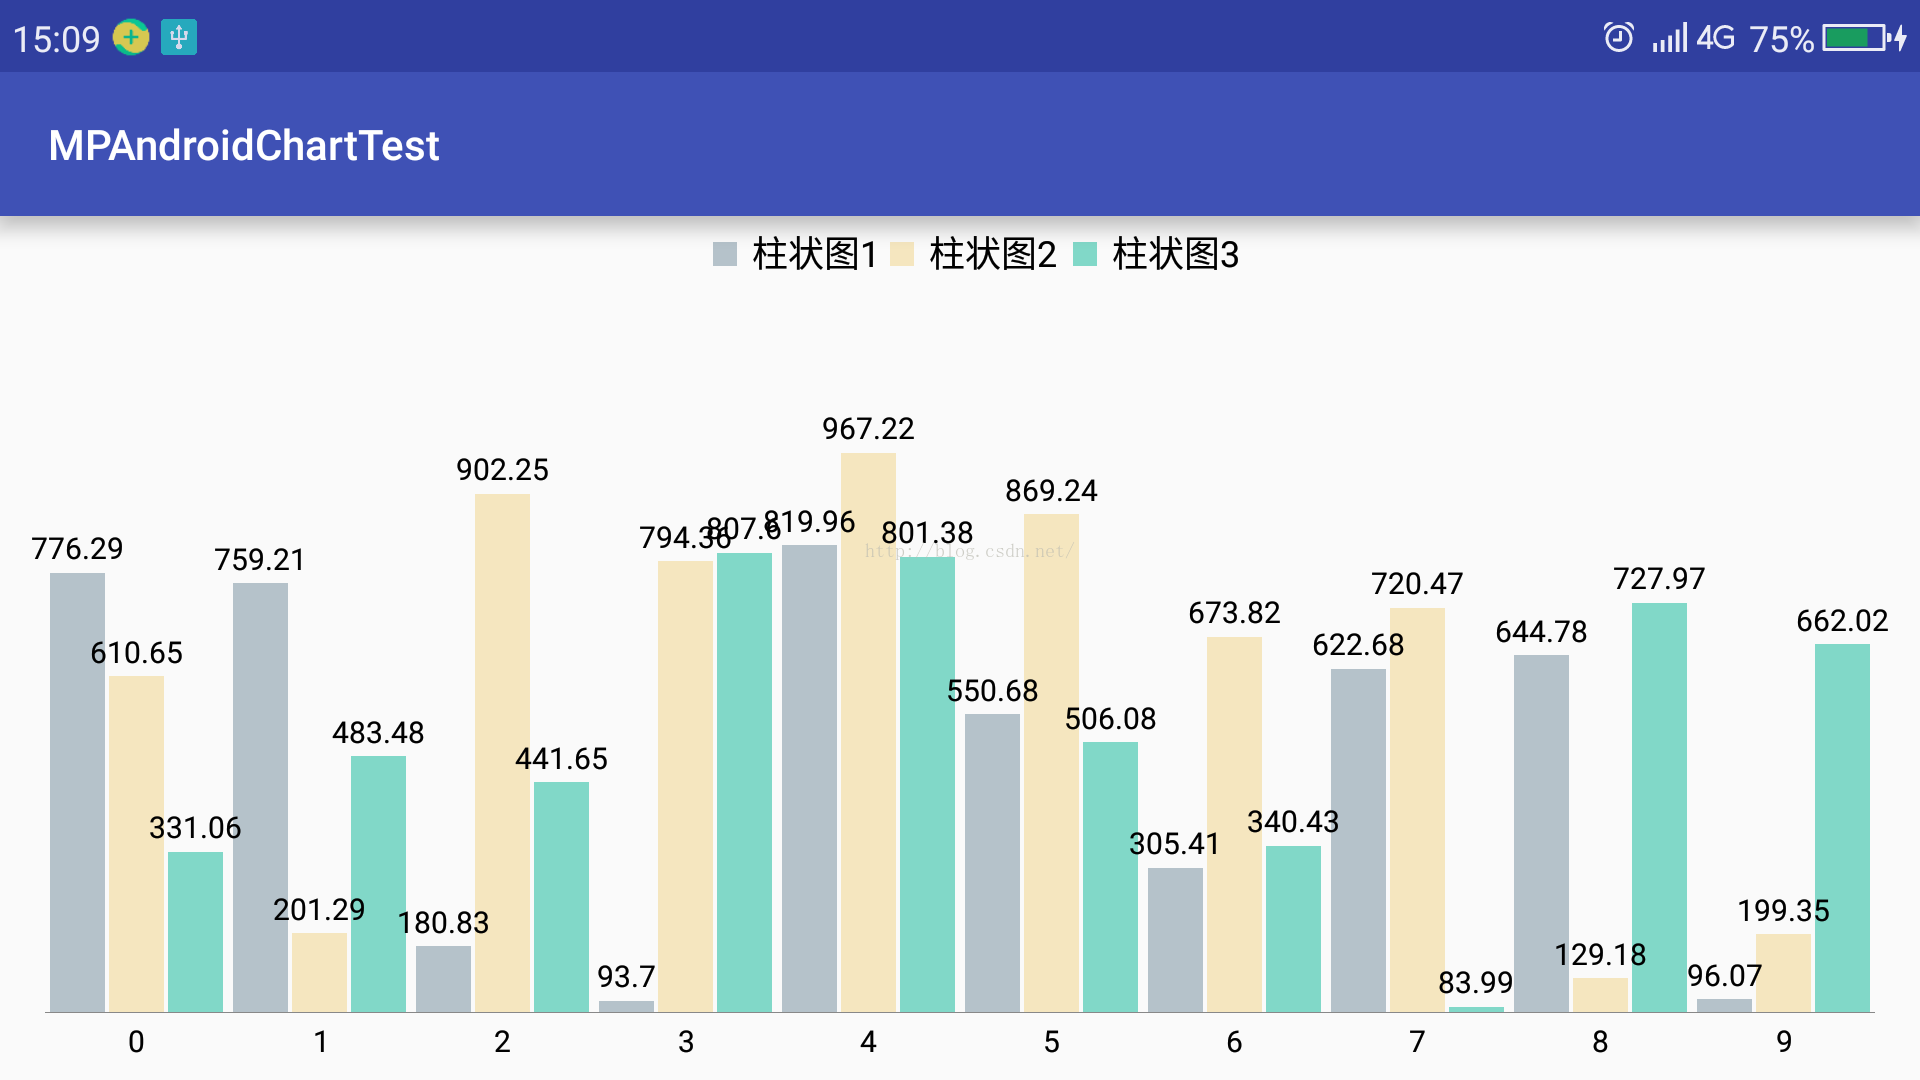
3、三柱图:
先看效果图,如下:
布局同1单柱图。设置好x轴和y轴要显示的数据,然后调用如下函数即可:
/**
* 设置三柱状图样式
*
* @param barChart
* @param xAxisValue
* @param yAxisValue1
* @param yAxisValue2
* @param yAxisValue3
* @param bartilte1
* @param bartitle2
* @param bartitle3
*/
public static void setThreeBarChart(BarChart barChart, List<Integer> xAxisValue, List<Float> yAxisValue1, List<Float> yAxisValue2, List<Float> yAxisValue3, String bartilte1, String bartitle2, String bartitle3) {
barChart.getDescription().setEnabled(false);//设置描述
barChart.setPinchZoom(false);//设置不按比例放缩柱状图
barChart.setExtraBottomOffset(10);
barChart.setExtraTopOffset(30);
MPChartMarkerView markerView = new MPChartMarkerView(barChart.getContext(), R.layout.custom_marker_view);
barChart.setMarker(markerView);
//x坐标轴设置
XAxis xAxis = barChart.getXAxis();
xAxis.setPosition(XAxis.XAxisPosition.BOTTOM);
xAxis.setGranularity(1f);
xAxis.setLabelCount(xAxisValue.size());
xAxis.setCenterAxisLabels(true);
xAxis.setDrawGridLines(false);
xAxis.setValueFormatter(new IAxisValueFormatter() {
@Override
public String getFormattedValue(float v, AxisBase axisBase) {
return String.valueOf((int) v);
}
});
//y轴设置
YAxis leftAxis = barChart.getAxisLeft();
leftAxis.setPosition(YAxis.YAxisLabelPosition.OUTSIDE_CHART);
leftAxis.setDrawGridLines(false);
leftAxis.setDrawLabels(false);
leftAxis.setDrawAxisLine(false);
Float yMin1 = Collections.min(yAxisValue1);
Float yMin2 = Collections.min(yAxisValue2);
Float yMin3 = Collections.min(yAxisValue3);
Float yMax1 = Collections.max(yAxisValue1);
Float yMax2 = Collections.max(yAxisValue2);
Float yMax3 = Collections.max(yAxisValue3);
Float yMinTemp = yMin1 < yMin2 ? yMin1 : yMin2;
Float yMin = yMinTemp < yMin3 ? yMinTemp : yMin3;
Float yMaxTemp = yMax1 > yMax2 ? yMax1 : yMax2;
Float yMax = yMaxTemp > yMax3 ? yMaxTemp : yMax3;
leftAxis.setAxisMinimum(Double.valueOf(yMin * 0.9).floatValue());
leftAxis.setAxisMaximum(Double.valueOf(yMax * 1.1).floatValue());
barChart.getAxisRight().setEnabled(false);
//图例设置
Legend legend = barChart.getLegend();
legend.setHorizontalAlignment(Legend.LegendHorizontalAlignment.CENTER);
legend.setVerticalAlignment(Legend.LegendVerticalAlignment.TOP);
legend.setOrientation(Legend.LegendOrientation.HORIZONTAL);
legend.setDrawInside(false);
legend.setDirection(Legend.LegendDirection.LEFT_TO_RIGHT);
legend.setForm(Legend.LegendForm.SQUARE);
legend.setTextSize(12f);
//设置柱状图数据
setThreeBarChartData(barChart, xAxisValue, yAxisValue1, yAxisValue2, yAxisValue3, bartilte1, bartitle2, bartitle3);
barChart.animateX(1500);//数据显示动画,从左往右依次显示
barChart.invalidate();
}
/**
* 设置三柱图数据源
*
* @param barChart
* @param xAxisValue
* @param yAxisValue1
* @param yAxisValue2
* @param yAxisValue3
* @param bartilte1
* @param bartitle2
* @param bartitle3
*/
private static void setThreeBarChartData(BarChart barChart, List<Integer> xAxisValue, List<Float> yAxisValue1, List<Float> yAxisValue2, List<Float> yAxisValue3, String bartilte1, String bartitle2, String bartitle3) {
float groupSpace = 0.04f;
float barSpace = 0.02f;
float barWidth = 0.3f;
// (0.3 + 0.02) * 3 + 0.04 = 1,即一个间隔为一组,包含三个柱图 -> interval per "group"
ArrayList<BarEntry> first_entries = new ArrayList<>();
ArrayList<BarEntry> second_entries = new ArrayList<>();
ArrayList<BarEntry> third_entries = new ArrayList<>();
for (int i = 0, n = xAxisValue.size(); i < n; ++i) {
first_entries.add(new BarEntry(xAxisValue.get(i), yAxisValue1.get(i)));
second_entries.add(new BarEntry(xAxisValue.get(i), yAxisValue2.get(i)));
third_entries.add(new BarEntry(xAxisValue.get(i), yAxisValue3.get(i)));
}
BarDataSet first_set, second_set, third_set;
if (barChart.getData() != null && barChart.getData().getDataSetCount() > 0) {
first_set = (BarDataSet) barChart.getData().getDataSetByIndex(0);
second_set = (BarDataSet) barChart.getData().getDataSetByIndex(1);
third_set = (BarDataSet) barChart.getData().getDataSetByIndex(2);
first_set.setValues(first_entries);
second_set.setValues(second_entries);
third_set.setValues(third_entries);
barChart.getData().notifyDataChanged();
barChart.notifyDataSetChanged();
} else {
first_set = new BarDataSet(first_entries, bartilte1);
second_set = new BarDataSet(second_entries, bartitle2);
third_set = new BarDataSet(third_entries, bartitle3);
first_set.setColor(ContextCompat.getColor(barChart.getContext(), R.color.bar1));
second_set.setColor(ContextCompat.getColor(barChart.getContext(), R.color.bar2));
third_set.setColor(ContextCompat.getColor(barChart.getContext(), R.color.bar3));
ArrayList<IBarDataSet> dataSets = new ArrayList<>();
dataSets.add(first_set);
dataSets.add(second_set);
dataSets.add(third_set);
BarData data = new BarData(dataSets);
data.setValueTextSize(10f);
data.setBarWidth(0.9f);
data.setValueFormatter(new IValueFormatter() {
@Override
public String getFormattedValue(float value, Entry entry, int i, ViewPortHandler viewPortHandler) {
return StringUtils.double2String(value, 2);
}
});
barChart.setData(data);
}
barChart.getBarData().setBarWidth(barWidth);
barChart.getXAxis().setAxisMinimum(xAxisValue.get(0));
barChart.getXAxis().setAxisMaximum(barChart.getBarData().getGroupWidth(groupSpace, barSpace) * xAxisValue.size() + xAxisValue.get(0));
barChart.groupBars(xAxisValue.get(0), groupSpace, barSpace);
}
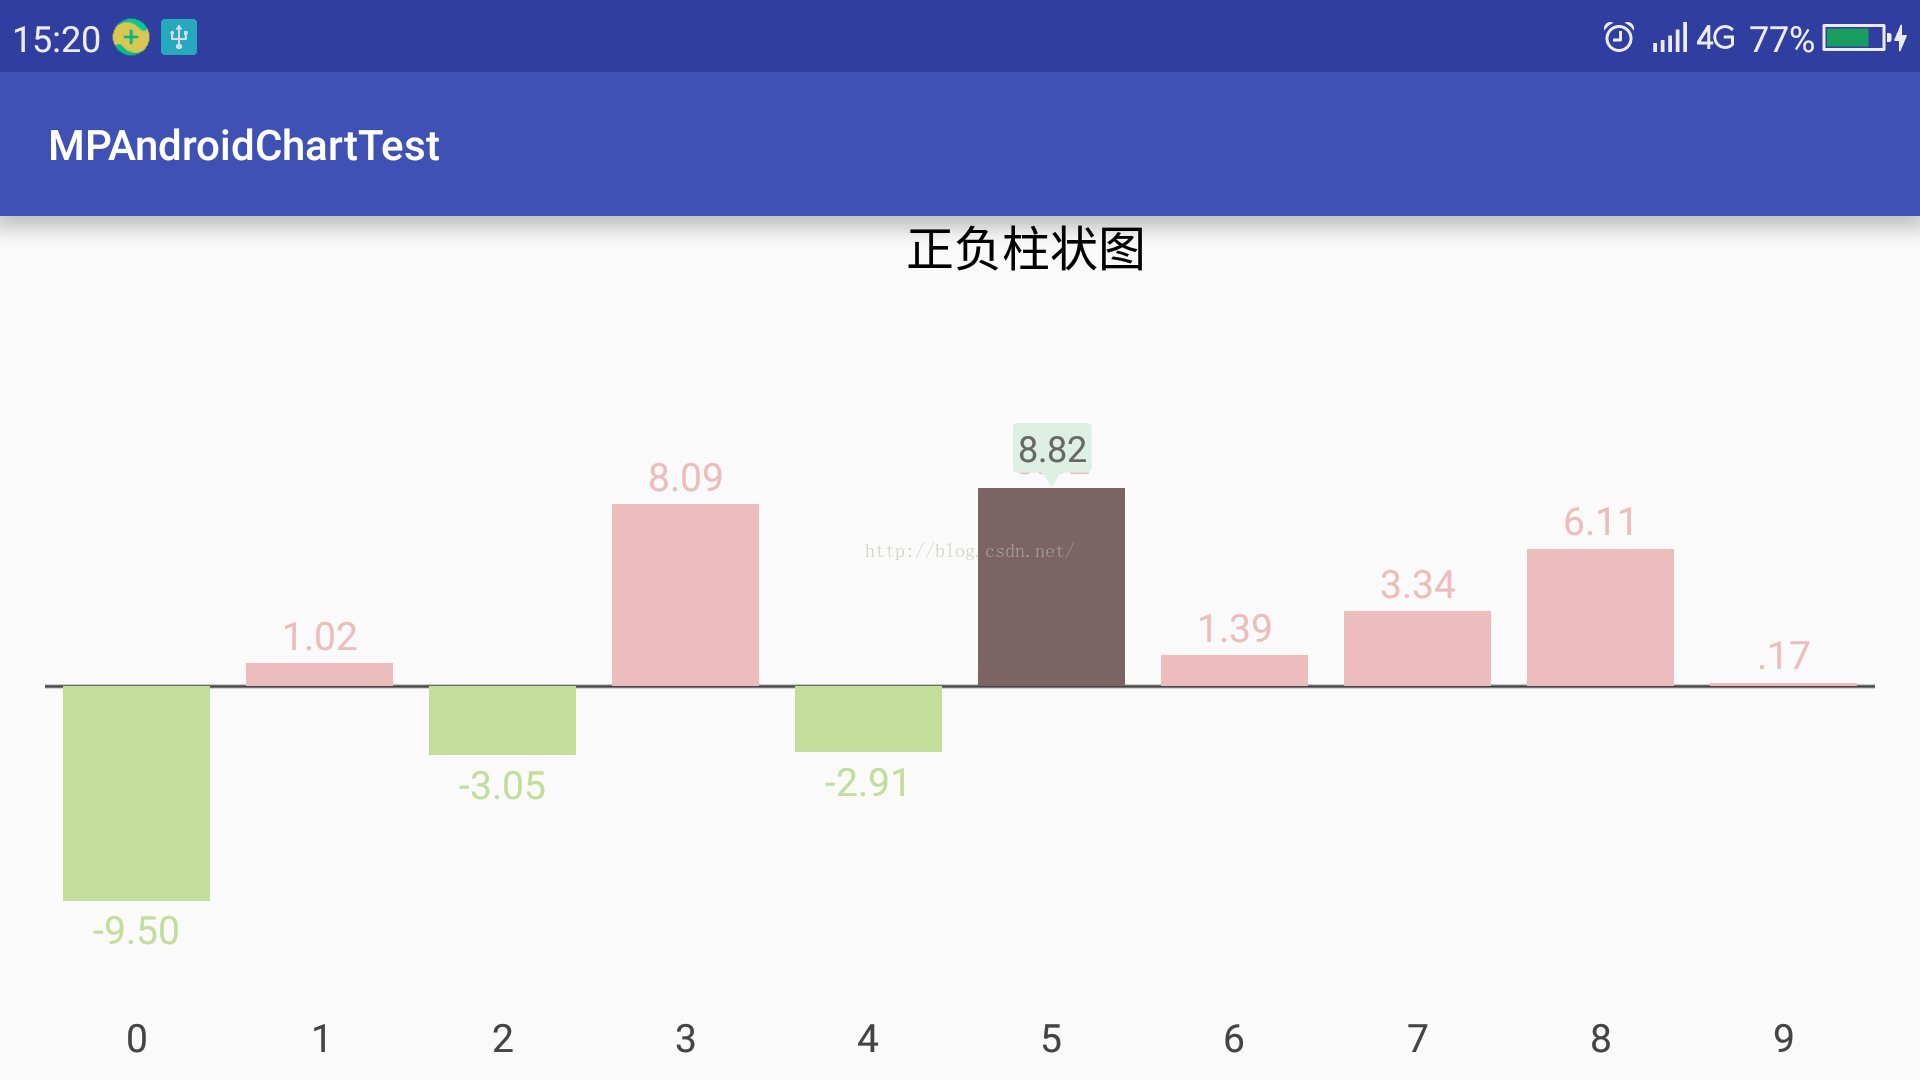
4、正负柱图:
先看效果图,如下: