社区微信群开通啦,扫一扫抢先加入社区官方微信群

社区微信群

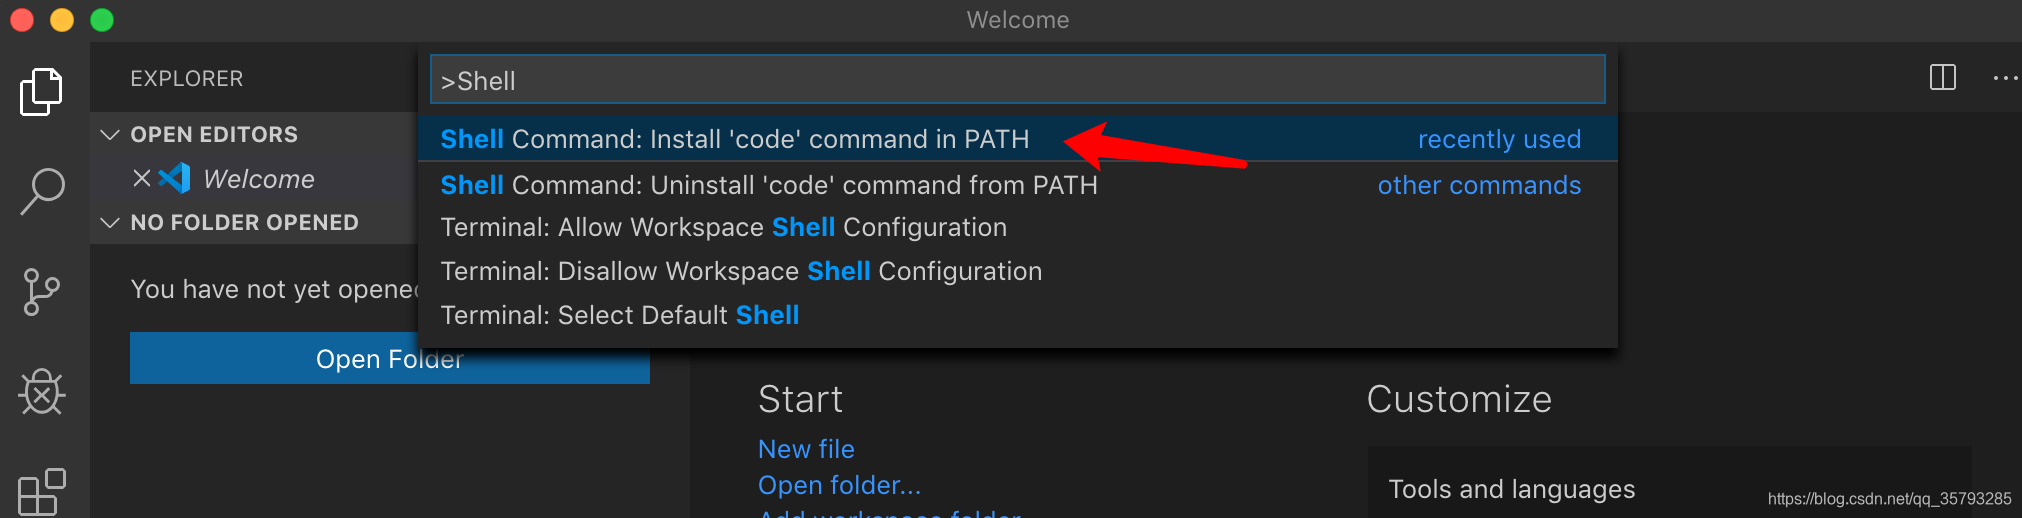
为了能从命令行中直接打开VS Code,我们需要把VS Code的路径添加到环境变量中,这个只需要在第一次使用时配置一次即可
In the macOS Terminal, create an empty folder called “projects” and then a subfolder called “helloworld”. Navigate into it, and open VS Code (code) in that folder (.) by entering the following commands:
在 mac 的Terminal 中创建一个叫做“projects”的空文件夹,然后创建一个叫做“helloworld”的子文件夹,在当前文件夹中打开vscode.具体命令如下:
mkdir projects
cd projects
mkdir helloworld
cd helloworld
code .
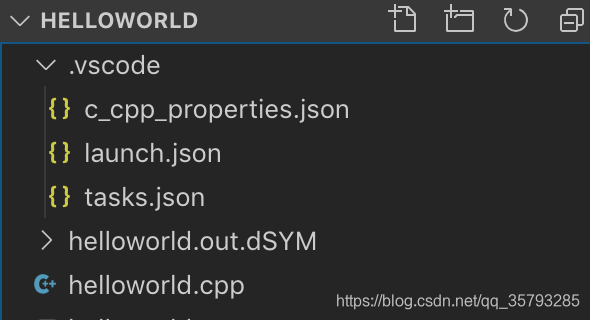
**code .**的意思是从当前文件夹中打开VS Code,同时这个文件夹会成为你的workspace,为了能够智能提示、编译以及调试你的代码,你还要配置VS Code来使用Clang/LLDB,在完成这些配置后,你会在.vscode子文件夹里看到三个文件.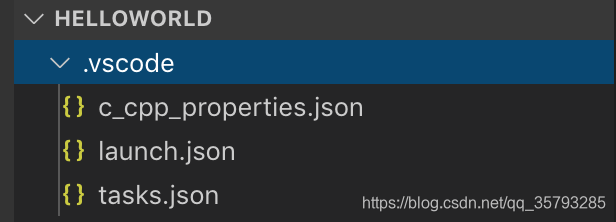
c_cpp_properties.json (编译路径和智能提示设置)tasks.json (链接指令)launch.json (调试设置)为了重复使用这些配置,你可以把这三个文件复制到新的workspace中,然后把程序名字和其他的配置改成你需要的设置.
按⇧⌘P 打开Command Palette,像这样
输入 “C/C++” 然后从列表中选择 Edit Configurations (UI),这就会打开 C/C++ 的配置页面,当你在这里改变设置, VS Code 会将你改变的设置写入到叫做c_cpp_properties.json的文件中,该文件存在于.vscode 文件夹.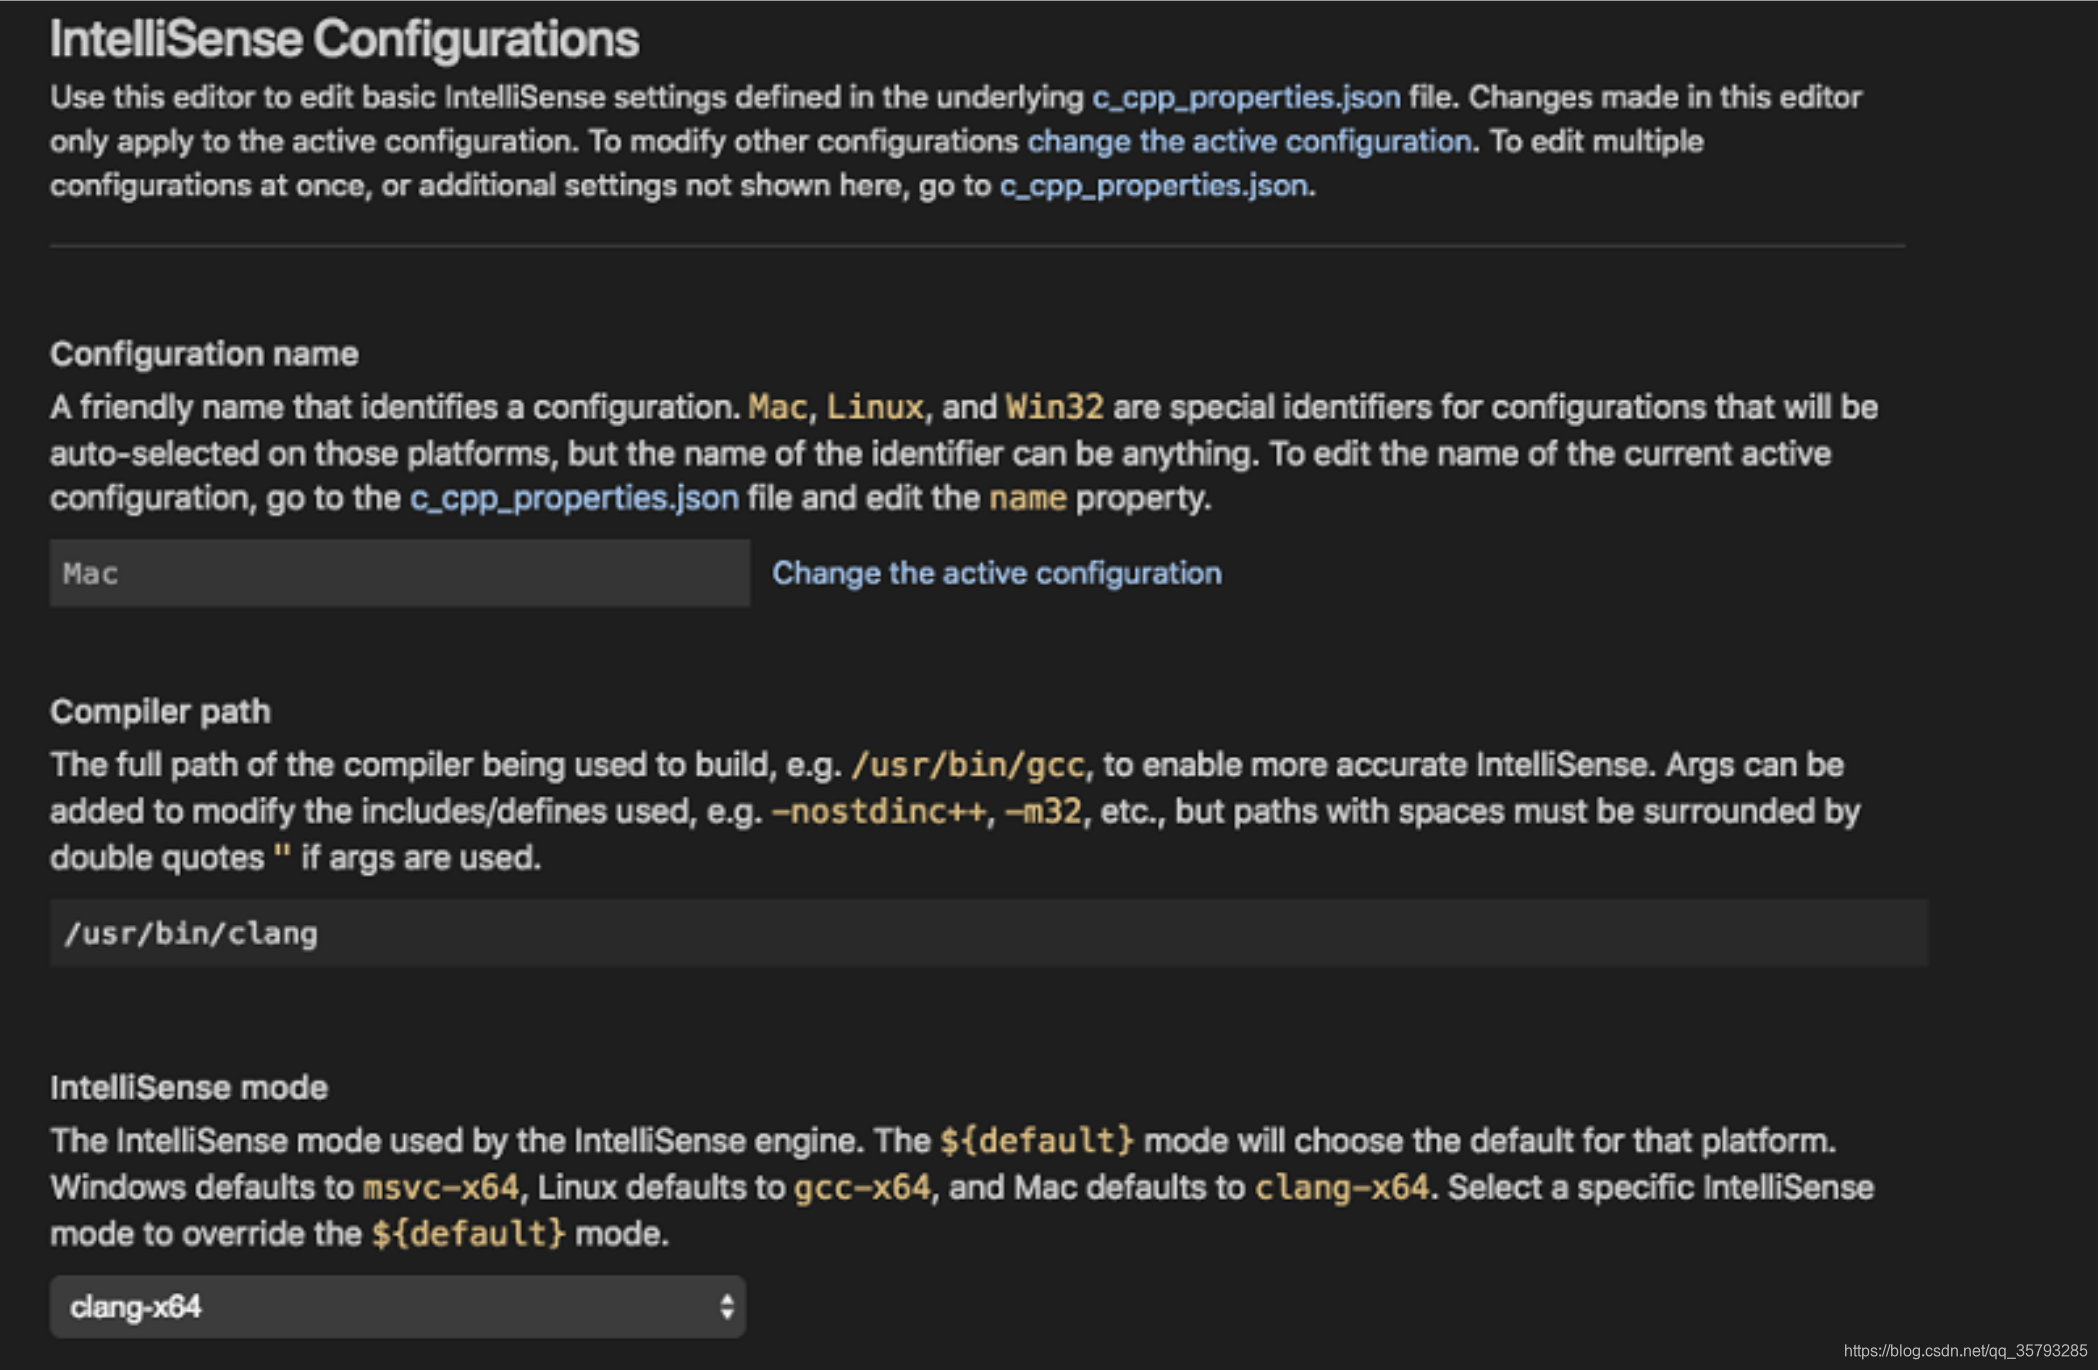
找到 Compiler path 设置,VS Code 会试着找到Clang的路径并填入其中, 这个路径应该是: /usr/bin/clang.
Compiler path 设置在你的配置中是非常重要的一个设置,C++的插件会根据它来找到C++标准库头文件的路径,当插件知道这些文件在哪儿时,它可以在你写代码时提供大量的有用信息,这些信息叫做智能提示,稍后你会看到一些例子.
设置 IntelliSense mode 为 ${default}, 这个在mac中是clang-x64.
You only need to modify the Include path setting if your program includes header files that are not in your workspace or in the standard library path如果你的程序包含一些没有在你workspace或者没在标准库路径中的头文件时,你需要把它的路径添加到这儿来,比如我的: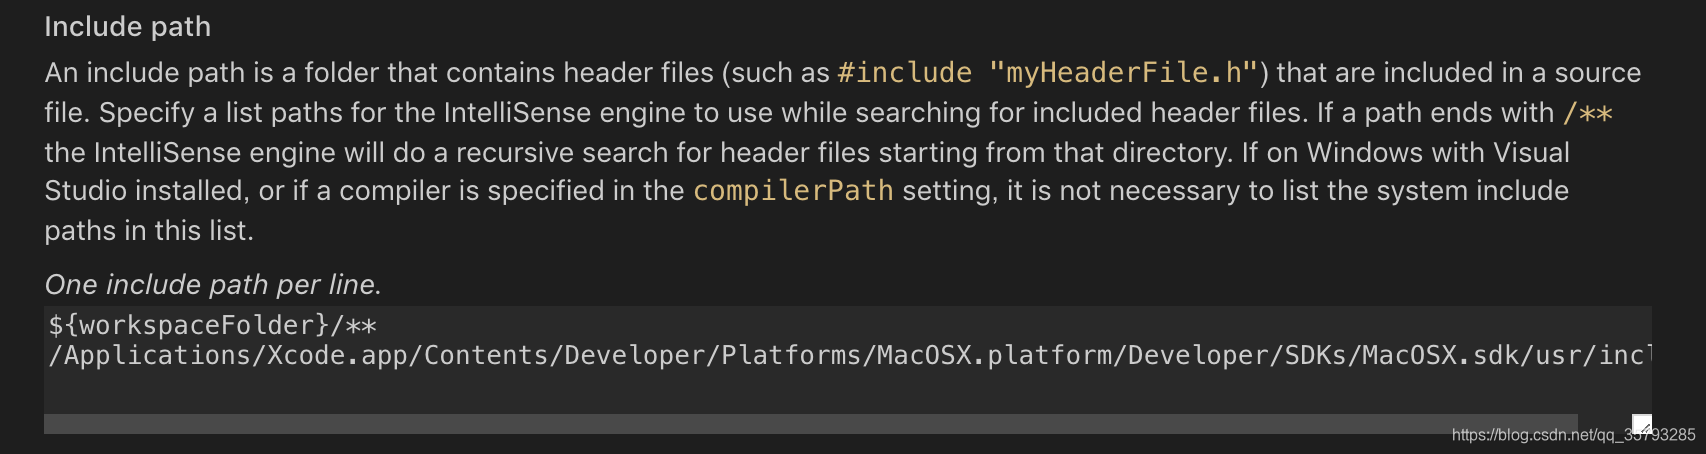
${workspaceFolder}/**
/Applications/Xcode.app/Contents/Developer/Platforms/MacOSX.platform/Developer/SDKs/MacOSX.sdk/usr/include

/Applications/Xcode.app/Contents/Developer/Platforms/MacOSX.platform/Developer/SDKs/MacOSX.sdk/System/Library/Frameworks
/System/Library/Frameworks
/Library/Frameworks
Visual Studio code 会将这些设置写入到.vscode/c_cpp_properties.json. 如果你直接打开这个文件 它应该长得像这样 (这依赖于你自己具体的路径:
{
    "configurations": [
        {
            "name": "Mac",
            "includePath": [
                "${workspaceFolder}/**",
                "/Applications/Xcode.app/Contents/Developer/Platforms/MacOSX.platform/Developer/SDKs/MacOSX.sdk/usr/include"
            ],
            "defines": [],
            "macFrameworkPath": [
                "/Applications/Xcode.app/Contents/Developer/Platforms/MacOSX.platform/Developer/SDKs/MacOSX.sdk/System/Library/Frameworks",
                "/System/Library/Frameworks",
                "/Library/Frameworks"
            ],
            "compilerPath": "/usr/bin/clang",
            "cStandard": "c11",
            "cppStandard": "c++17",
            "intelliSenseMode": "${default}"
        }
    ],
    "version": 4
}
接下来我们需要创建一个 tasks.json 文件来告诉 VS Code 怎么链接(编译)程序,这个 task 将调用 Clang 编译器来基于源代码创建一个可执行文件.
Tasks: Configure Default Build Task. 然后在选择Create tasks.json file from template, 之后选择 Others,VS Code 就会创建一个最小的 tasks.json 文件并自动打开.{
// See https://go.microsoft.com/fwlink/?LinkId=733558
// for the documentation about the tasks.json format
"version": "2.0.0",
"tasks": [
{
"label": "Build with Clang",
"type": "shell",
"command": "clang++",
"args": [
"-std=c++17",
"-stdlib=libc++",
"helloworld.cpp",
"-o",
"helloworld.out",
"--debug"
],
"group": {
"kind": "build",
"isDefault": true
}
}
]
}
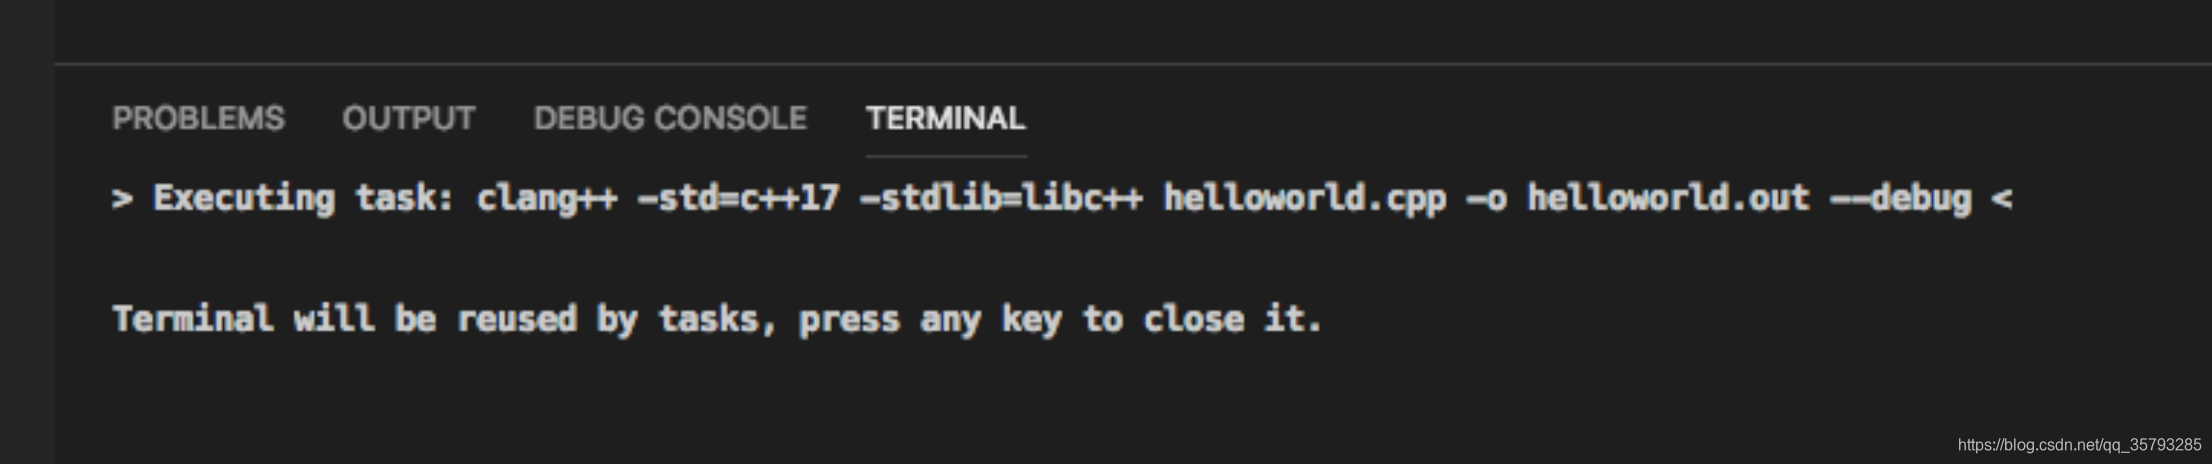
label 是用来在VS Code Command Palette中辨认的一个名字而已; 你可以改成任何你喜欢的名字,这个args数组会按编译器预期的顺序传递命令行参数.
isDefault": true当你在按 ⇧⌘B 时会运行该任务. --debug参数会生成调试符号,这是调试时单步执行代码所必需的.
Next, we’ll configure VS Code to launch the LLDB debugger when you press F5.
From the Command Palette, type “launch” and then choose Debug: Open launch.json. Next, choose the GDB/LLDB environment.
For program, use the program name ${workspaceFolder}/helloworld.out (which matches what you specified in tasks.json).
By default, the C++ extension adds a breakpoint to the first line of main. The stopAtEntry value is set to true to cause the debugger to stop on that breakpoint. You can set this to false if you prefer to ignore it.
Set externalConsole to true to display the program output in an external Terminal window. (Currently on Mac the output cannot be directed to the integrated Terminal window.)
Your complete launch.json file should look something like this:
{
    "version": "0.2.0",
    "configurations": [
        {
            "name": "(lldb) Launch",
            "type": "cppdbg",
            "request": "launch",
            "program": "${workspaceFolder}/helloworld.out",
            "args": [],
            "stopAtEntry": true,
            "cwd": "${workspaceFolder}",
            "environment": [],
            "externalConsole": true,
            "MIMode": "lldb",
            "logging": {
                "trace": true,
                "traceResponse": true,
                "engineLogging": true
            }
        }
    ]
}
VS Code is now configured to use Clang on macOS. The configuration applies to the current workspace. To reuse the configuration, just copy the three JSON files to a .vscode folder in a new workspace and change the names of the source file(s) and executable as needed.
The remaining steps are provided as an optional exercise to help you get familiar with the editing and debugging experience.
In the main VS Code menu, click on File > New File and name it helloworld.cpp.
Paste in this source code:
#include <iostream>
#include <vector>
#include <string>

using namespace std;

int main()
{

    vector<string> msg {"Hello", "C++", "World", "from", "VS Code!"};

    for (const string& word : msg)
    {
        cout << word << " ";
    }
    cout << endl;
}
In your new helloworld.cpp file, hover over vector or string to see type information. After the declaration of the msg variable, start typing msg. as you would when calling a member function. You should immediately see a completion list that shows all the member functions, and a window that shows the type information for the msg object: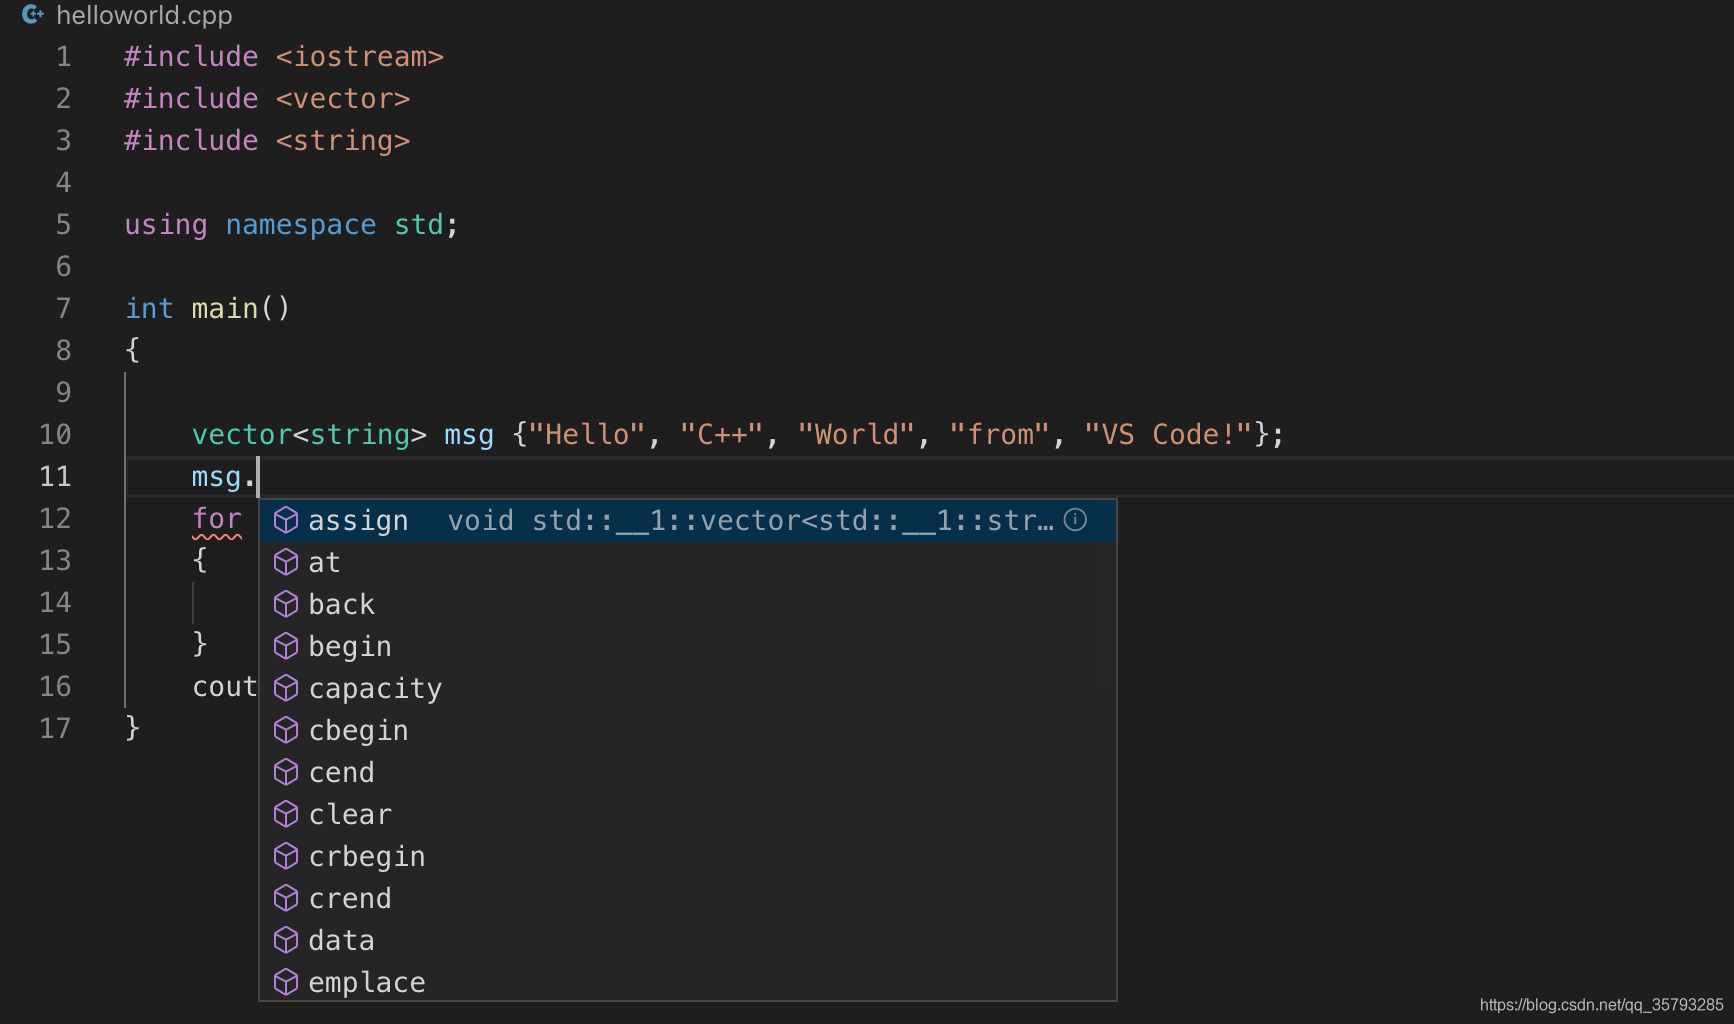
The Debug Console appears and displays output from the debugger.
The code editor highlights the first statement in the main method. This is a breakpoint that the C++ extension automatically sets for you:
The workspace pane on the left now shows debugging information. These windows will dynamically update as you step through the code.
At the top of the code editor, a debugging control panel appears. You can move this around the screen by grabbing the dots on the left side.
Now we’re ready to start stepping through the code.
Click or press the Step over icon in the debugging control panel.
This will advance program execution to the first line of the for loop, and skip over all the internal function calls within the vector and string classes that are invoked when the msg variable is created and initialized. Notice the change in the Variables window on the left. In this case, the errors are expected because, although the variable names for the loop are now visible to the debugger, the statement has not executed yet, so there is nothing to read at this point. The contents of msg are visible, however, because that statement has completed.
Press Step over again to advance to the next statement in this program (skipping over all the internal code that is executed to initialize the loop). Now, the Variables window shows information about the loop variables.
Press Step over again to execute the cout statement. Your application is now running in a macOS Terminal window. Press Cmd+Tab to find it. You should see Hello output there on the command line.
If you like, you can keep pressing Step over until all the words in the vector have been printed to the console. But if you are curious, try pressing the Step Into button to step through source code in the C++ standard library!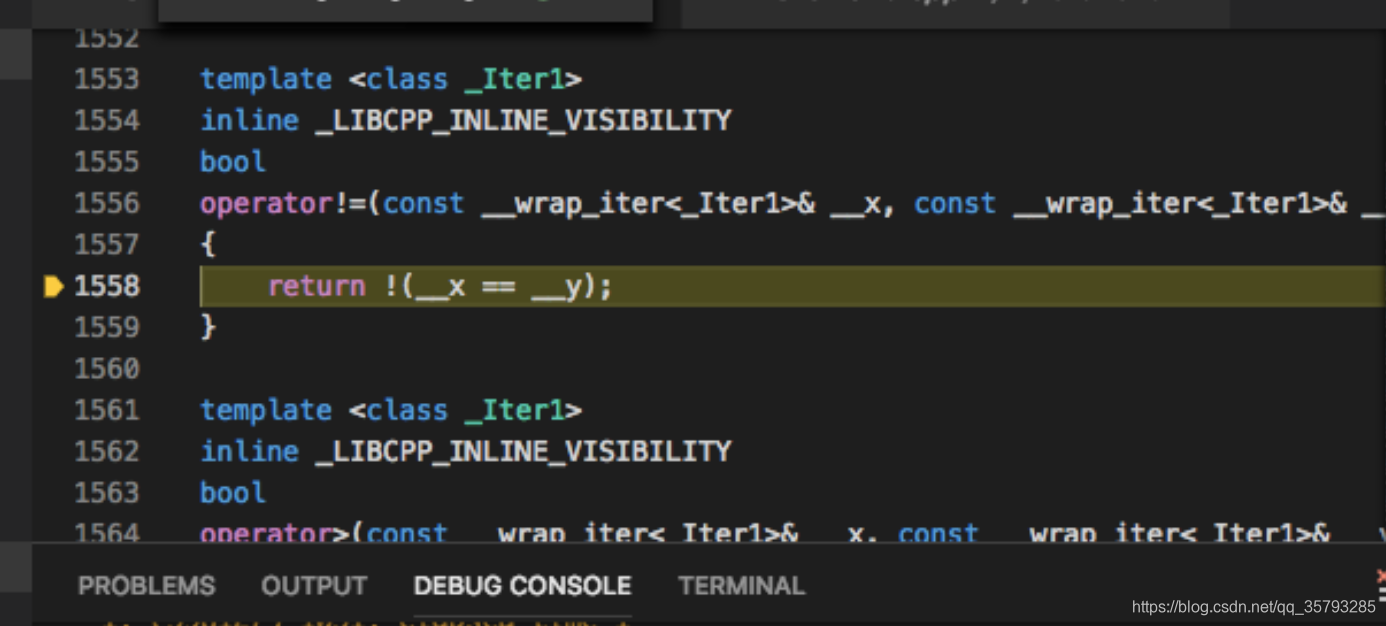
To return to your own code, one way is to keep pressing Step over. Another way is to set a breakpoint in your code by switching to the helloworld.cpp tab in the code editor, putting the insertion point somewhere on the cout statement inside the loop, and pressing F9. A red dot appears in the gutter on the left to indicate that a breakpoint has been set on this line.
Then press F5 to start execution from the current line in the standard library header. Execution will break on cout. If you like, you can press F9 again to toggle off the breakpoint.
Sometimes you might want to keep track of the value of a variable as your program executes. You can do this by setting a watch on the variable.
Place the insertion point inside the loop. In the Watch window, click the plus sign and in the text box, type word, which is the name of the loop variable. Now view the Watch window as you step through the loop.
Add another watch by adding this statement before the loop: int i = 0;. Then, inside the loop, add this statement: ++i;. Now add a watch for i as you did in the previous step.
To quickly view the value of any variable while execution is paused on a breakpoint, you can simply hover over it with the mouse pointer.
原文链接: VS Code C/C++ 配置指南
如果觉得我的文章对您有用,请随意打赏。你的支持将鼓励我继续创作!
