社区微信群开通啦,扫一扫抢先加入社区官方微信群

社区微信群
我们很容易就用free命令看到系统的cache使用量,但是你知道是哪些程序的文件在消耗cache吗?虽然cache在严格意义上也是可以当做free的内存使用的,也可以通过 echo 3>/proc/sys/vm/drop_caches来主动释放,但是你真的确定运行这条命之后,cache的数据回写到磁盘不会造成你的系统IO飙升而出现其他问题吗?你确定当前系统是可以清理page cache的吗?为了弄明白,到底是哪些文件被缓存了。今天就来写个脚本探测一下系统进程所打开的那些文件在消耗我们的cache。
先来看一下我们的内存使用情况:
# free
              total        used        free      shared  buff/cache   available
Mem:        3882572      762388      398412      194732     2721772     2586636
Swap:
一开始我是参考余枫大拿的这篇文章(http://blog.yufeng.info/archives/688),需要用上高大上的System Tap来探测,这对于某些线上环境的机器来说是不可能给你安装kernel-debug,kernel-devel-debug 几百兆的包来跑System Tap脚本的。
然后我用到了他文章最后提到的那个工具fincore,是由国外的大拿开发的专门用来探测系统的哪些文件正在被cache。(下载地址:https://code.google.com/p/linux-ftools/source/browse/#hg%253Fstate%253Dclosed)
下载下来按照说明,简单安装./configure && make && make install,编译 生成的三个工具linux-fincore、linux-fallocate、linux-fadvise 在/usr/local/bin/目录下。
今天只用到linux-fincore,他的用法比较简单:
# linux-fincore
fincore version 1.3.0
fincore [options] files...
  -s --summarize          When comparing multiple files, print a summary report
  -p --pages              Print pages that are cached
  -o --only-cached        Only print stats for files that are actually in cache.
  -g --graph              Print a visual graph of each file's cached page distribution.
  -S --min-size           Require that each files size be larger than N bytes.
  -C --min-cached-size    Require that each files cached size be larger than N bytes.
  -P --min-perc-cached    Require percentage of a file that must be cached.
  -h --help               Print this message.
  -L --vertical           Print the output of this script vertically.
使用过程中发现下面的这些参数貌似都不好用,输出都是一样的内容,先来看一个库文件的缓存情况:
# linux-fincore -o /usr/lib64/libz.so.1.2.7
linux-fincore: invalid option -- 'o'
filename                                                                                       size        total_pages    min_cached page       cached_pages        cached_size        cached_perc
--------                                                                                       ----        -----------    ---------------       ------------        -----------        -----------
/usr/lib64/libz.so.1.2.7                                                                     90,632                 23                  0                 23             94,208             100.00
---
total cached size: 94,208
右侧显示size(Byte), total_pages, min_cached page, cached_pages, cached_size,cached_perc。
这里可以看到该文件的缓存率是100,就是说它是被完全被缓存起来的,这也可以理解,库文件经常被调用,缓存起来可以提高访问速度。
需要注意的是,他只能查看指定的文件是否是被缓存的,而不能指定目录,因为linux 的cache是只缓存文件的。
fincore的工作原理是将指定的文件的相应inode data与kernel的 page cache table做对比,如果page cache table有这个inode 信息,就找该inode对应的data block的大小。因为kernel的page cache table只存储data block的引用而不是文件名,即文件的inode信息。所以并没有任何一个工具运行一次就可以找出所有的文件使用缓存的情况,如果你非要对系统的所有文件都用linux-fincore查看一遍的话,那我就不跟你做朋友了:(。
所以使用linux-fincore只能加文件名,来判断该文件是否被缓存,如果缓存,大小是多少。问题是你不能随便猜哪个文件是否被缓存吧,我突然想到了一个方法,既然cache也是内存的一部分,那就查看哪些进程使用的物理内存最多,就找到该进程打开的文件,然后用fincore查看这些文件的缓存使用率。
在这之前,我们先看一下top输出的VIRT, RES, SHR值的含义。来看看man手册给我们的解释:
VIRT  --  Virtual Memory Size (KiB)
           The total amount of virtual memory used by the task.  It includes all code, data and shared libraries plus pages that have
           been swapped out and pages that have been mapped but not used.
一个任务使用的虚拟内存的总量,包括 代码、数据、共享库加上已换出的页和已经被映射出去了但是还没被使用的页。 简单理解就是所有的虚拟内存中含有共享库、共享内存、堆、栈和所有已经申请的内存空间。
利用命令查看:vsz=data + code + shared lib
$ ps -a -o pid,pmem,cmd,vsz,drs,trs
  PID %MEM CMD                            VSZ   DRS  TRS
 3870  0.0 ps -a -o pid,pmem,cmd,vsz,d 148912 148822  89
10906  0.0 screen -dr                  129744 129744   0
16116  0.0 sudo -i                     195524 195524   0
16117  0.3 -zsh                        156876 156876   0
 RES  --  Resident Memory Size (KiB)
           The non-swapped physical memory a task is using.
一个任务使用的不可交换的物理内存大小。是一个进程正在使用的内存空间(堆、栈)。
SHR  --  Shared Memory Size (KiB)
           The amount of shared memory available to a task, not all of which is typically resident.  It simply reflects memory that could be  potentially
           shared with other processes.
一个任务正在使用的共享内存大小,这个大小对该进程不是固定的,它只是简单底反应了可以被其他进程共享的内存大小。
因为cache使用的是物理内存,所以与swap就无关了。所以只关心RES的值。我们来写个脚本来查看当前系统的哪些文件正在消耗我们的cache。思路是找到使用RES最高的前10个进程,然后用lsof找到该进程正在使用的文件,最后把这些文件交给fincore来处理。
#!/bin/bash
#Author: Shanker
#Time: 2016/06/08
#set -e
#set -u
#you have to install linux-fincore
if [ ! -f /usr/local/bin/linux-fincore ]
then
echo "You haven't installed linux-fincore yet"
exit
fi
#find the top 10 processs' cache file
ps -e -o pid,rss|sort -nk2 -r|head -10 |awk '{print $1}'>/tmp/cache.pids
#find all the processs' cache file
#ps -e -o pid>/tmp/cache.pids
if [ -f /tmp/cache.files ]
then
echo "the cache.files is exist, removing now "
rm -f /tmp/cache.files
fi
while read line
do
lsof -p $line 2>/dev/null|awk '{print $9}' >>/tmp/cache.files
done</tmp/cache.pids
if [ -f /tmp/cache.fincore ]
then
echo "the cache.fincore is exist, removing now"
rm -f /tmp/cache.fincore
fi
for i in `cat /tmp/cache.files`
do
if [ -f $i ]
then
echo $i >>/tmp/cache.fincore
fi
done
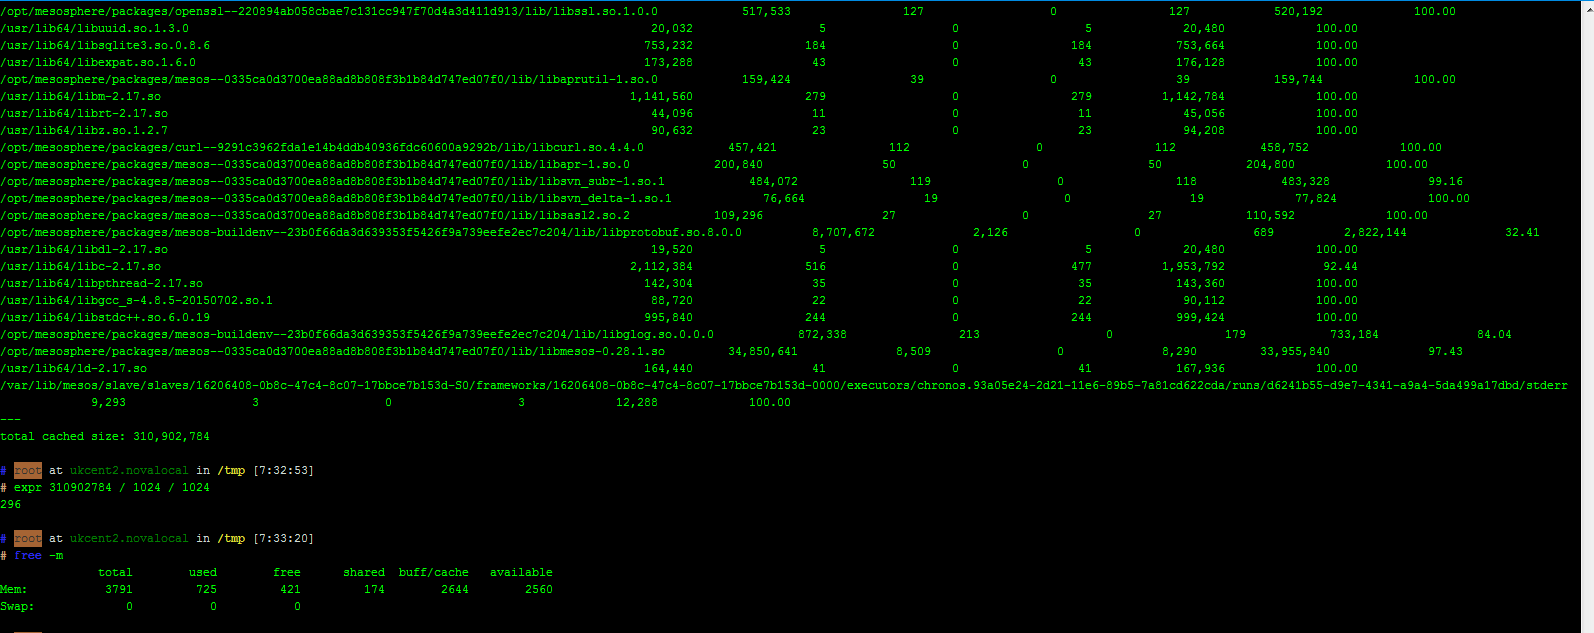
linux-fincore -s `cat /tmp/cache.fincore`
rm -f /tmp/cache.{pids,files,fincore}
运行效果如下,可以看到内存使用率最高的前十个进程缓存的文件占用了296MB的内存。
当然脚本可以实现查看系统所有进程所打开的文件cache 状态,如果你不想让你的磁盘I/O搞成这的话,可以试试。
参考链接:
http://serverfault.com/questions/278454/is-it-possible-to-list-the-files-that-are-cached
http://blog.yufeng.info/archives/688
欢迎补充!
如果觉得我的文章对您有用,请随意打赏。你的支持将鼓励我继续创作!