社区微信群开通啦,扫一扫抢先加入社区官方微信群

社区微信群
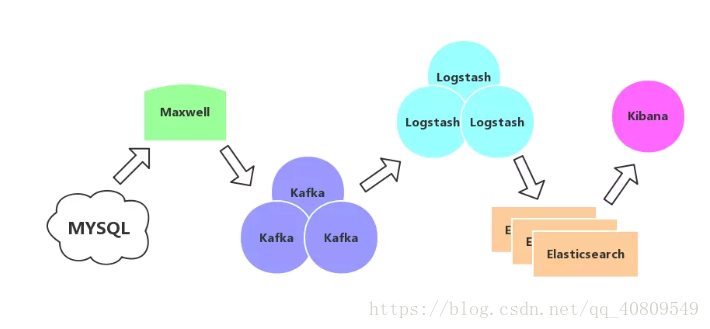
MySQL+Maxwell+Kafka+ES+kibana实现MySQL日志分析
参考:
https://blog.csdn.net/qq_30921461/article/details/78320750
http://blog.sina.com.cn/s/blog_628cc2b70102xeha.html
https://www.jianshu.com/p/afc4dcc9ffb6
https://www.cnblogs.com/swordfall/p/8860941.html
https://www.cnblogs.com/moonandstar08/p/6556899.html
https://blog.csdn.net/sinat_28224453/article/details/51134978
https://blog.csdn.net/weixin_38441544/article/details/82382567
系统架构如图
1、Mysql配置
vi /etc/my.cnf
server-id=1
log-bin=mysql-bin(这一步开启binlog)
binlog_format=row
重启mysql:service mysqld restart
手工新建一个数据库maxwell(字符集utf8,也可以是别的名字,但必须和maxwell的config中的保持一致),maxwell将在该库内保存相关作业信息;如果不建,maxwell启动时会自己创建(如果config里面的数据库用户有足够权限的话)。
创建maxwell用户,拥有maxwell库全部权限,其他库对象的复制权限:
GRANT ALL on maxwell.* to 'maxwell'@'%' identified by '123456';
GRANT SELECT, REPLICATION CLIENT, REPLICATION SLAVE on *.* to 'maxwell'@'%' ;
flush privileges;
mysql配置确认:
(1)mysql中配置binlog,开启后通过"show variables like 'log_bin';"查看是否ON的状态
(2)mysql中配置binlog的输出格式为row,开启后通过"show variables like 'binlog_format';"查看
(3)mysql开启log_slave_updates,该参数控制是否把所有的操作写入到binlog中,开启后通过"show variables like 'log_slave_updates';"查看
2、maxwell的安装及部署
下载: https://github.com/zendesk/maxwell/releases/download/v1.17.1/maxwell-1.17.1.tar.gz
解压:tar-xvf maxwell-1.17.1.tar.gz
修改配置:config.properties,增加mysql和kafka相关参数
log_level=info
host=
user=
password=
port=
jdbc_options=autoReconnect=true
schema_database= // 用于在mysql中新建一个binlog相关的数据库实例
producer=kafka
kafka.bootstrap.servers=
kafka_topic=
kafka.compression.type=snappy
kafka.retries=1
kafka.acks=1
kinesis_stream=maxwell
include_dbs= // 需要处理的数据库实例
include_tables= // 需要处理的表格,用逗号分隔
kafka_version=0.9.0.1
client_id= // 标识符,可以包含英文
replica_server_id= // 只能是数字
启动:bin/maxwell (不能进入bin下执行./maxwell,读不到配置)
通过kafka验证:./kafka-console-consumer.sh --zookeeper 192.168.2.12:2181 --from-beginning --topic maxwell
到kafka安装目录bin目录下执行消费脚本,可以看到数据库相关修改记录已经同步到kafka,本次测试kafka版本:2.10-0.10.2.0
为便于排查错误,这一步也可以分步验证测试:
maxwell连接mysql:
bin/maxwell --user='maxwell' --password='XXXXXX' --host='mysql_host' --producer=stdout
maxwell连接kafka
bin/maxwell --user='maxwell' --password='XXXXXX' --host='mysql_host' --producer=kafka --kafka.bootstrap.servers=kafka_host:9092 --log_level=debug
配置 log_level 的环境变量值为debug可以查看maxwell运行时更加详细的log输出。不配置次环境变量时默认为 info。
若一切正常,kafka 的 maxwell 的topic的consumer能够收到MySQL的binlog数据更新,格式为json,如上文中说到kafka验证。
3、elasticsearch 的安装和配置
需要安装JDK1.8并配置环境变量(略)
下载:https://www.elastic.co/downloads/elasticsearch
解压:tar -xvf elasticsearch-6.4.0.tar.gz
修改配置:
启动:cd elasticsearch-6.4.0 && ./elasticsearch
启动报错:
格式问题:Exception in thread "main" 2017-11-10 06:29:49,106 main ERROR No log4j2 configuration file found. Using default configuration: logging only errors to the console. Set system property 'log4j2.debug' to show Log4j2 internal initialization logging.ElasticsearchParseException[malformed, expected settings to start with 'object', instead was [VALUE_STRING]]
原因:elasticsearch.yml中的配置项的格式有问题
解决方案:请尽量保持冒号前面没空格,后面一个空格,不要用tab键
ERROR: [6] bootstrap checks failed
[1]: initial heap size [536870912] not equal to maximum heap size [1073741824]; this can cause resize pauses and prevents mlockall from locking the entire heap
解决:之前改了一下jvm配置最小内存低于最大内存,改成一致的
[2]: max file descriptors [4096] for elasticsearch process is too low, increase to at least [65536]
解决:修改系统参数limits.conf,这里需要注意,数值不能随便改,我刚从坑里爬出来: https://blog.csdn.net/qq_40809549/article/details/82658720
[3]: memory locking requested for elasticsearch process but memory is not locked
解决:bootstrap.memory_lock: false 或者注释掉
[4]: max number of threads [1024] for user [mesk] is too low, increase to at least [4096]
解决:修改limits.conf和/etc/security/limits.d/90-nproc.conf,取两者最小值
参考:https://blog.csdn.net/mensuo1111/article/details/40187745
[5]: max virtual memory areas vm.max_map_count [65530] is too low, increase to at least [262144]
解决:修改/etc/sysctl.conf中的vm.max_map_count=655360,然后执行sysctl -p
[6]: system call filters failed to install; check the logs and fix your configuration or disable system call filters at your own risk
解决:Centos6不支持SecComp,而ES5.2.0之后默认bootstrap.system_call_filter为true
禁用:在elasticsearch.yml中配置bootstrap.system_call_filter为false,注意要在Memory下面:
bootstrap.memory_lock: false
bootstrap.system_call_filter: false ##配置文件里面没有就新增该参数
包括一启动就报错:unable to install syscall filter:
解决掉上面这些问题后,顺利启动。
插件安装:
Elasticsearch Head Plugin: 对ES进行各种操作,如查询、删除、浏览索引等。
参考:https://blog.csdn.net/sinat_28224453/article/details/51134978 5.0版本之后不适用
安装git:yum install git
下载插件:git clone git://github.com/mobz/elasticsearch-head.git
安装工具:yum -y install nodejs npm
node/npm安装参考:https://www.cnblogs.com/wuyoucao/p/7011666.html
后续安装参考:https://blog.csdn.net/gtsina/article/details/76551112
cd elasticsearch-head/
npm install
修改配置
① 修改elasticsearch.yml,增加跨域的配置(需要重启es才能生效)
http.cors.enabled: true
http.cors.allow-origin: "*"
② 编辑head/Gruntfile.js,修改服务器监听地址,增加hostname属性,将其值设置为*。
connect: {
hostname: '*',
server: {
options: {
port: 9100,
base: '.',
keepalive: true
}
}
}
③ 编辑head/_site/app.js,修改head连接es的地址,将localhost修改为es的IP地址
this.base_uri = this.config.base_uri || this.prefs.get("app-base_uri") || "http://YOUR-ES-IP:9200";
启动elasticsearch-head
cd elasticsearch-head/ && ./node_modules/grunt/bin/grunt server
然后就可以通过http://YOUR-ES-head-IP:9100 去访问了
PS:① 此时elasticsearch-head为前台启动,如果终端退出,那么elasticsearch-head服务也会随之关闭。
② 在非elasticsearch-head目录中启动server会失败!因为grunt需要读取目录下的Gruntfile.js。
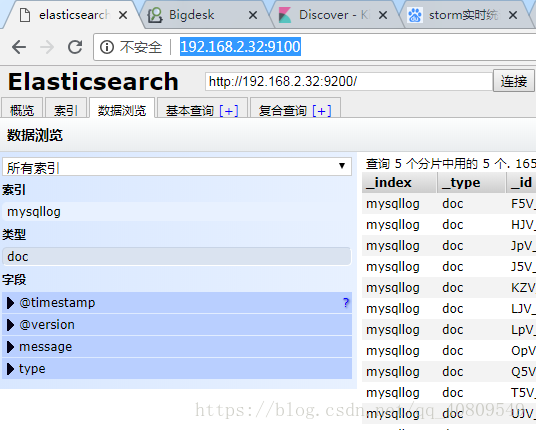
晒一下:
BigDesk Plugin : 对集群中es状态进行监控。
参考:
https://blog.csdn.net/Kspring_305718851/article/details/79539943
https://blog.csdn.net/yelllowcong/article/details/78791975
下载:git clone https://github.com/hlstudio/bigdesk
cd bigdesk/_site/
Python -m SimpleTHHPServer
页面访问http://xxx.xxx.xxx.xxx:8000 ,即可进入监控页面
4、logstash的安装和配置
下载:https://www.elastic.co/cn/downloads/logstash
解压:tar -xvf logstash-6.4.0.tar.gz
配置环境变量: vi /etc/profile
export LOGSTASH_HOME=/home/mesk/es/logstash-6.4.0
export PATH=:$PATH:$LOGSTASH_HOME/bin
立即生效:source /etc/profile
新建配置文件kafka-logstash-es.conf置于logstash/conf目录,配置如下:
input {
kafka {
type => "mysqllog"
codec => "plain"
auto_offset_reset => "earliest"
client_id => "es1"
group_id => "es1"
topics => "maxwell"
bootstrap_servers => "192.168.2.12:9092"
}
}
output {
elasticsearch {
index => "mysqllog"
codec => "json"
hosts => "192.168.2.32:9200"
}
}
启动:nohup bin/logstash -f /XXX/logstash/conf/kafka-logstash-es.conf &
初始启动可能会有一些报错,主要是上述配置文件的问题,可能是参考的版本不符,或者格式不对等原因,我参考的是这个版本:https://www.cnblogs.com/swordfall/p/8860941.html
5、kibana的安装和配置
参考:https://blog.csdn.net/cb2474600377/article/details/78963247
下载:wget https://artifacts.elastic.co/downloads/kibana/kibana-6.4.0-linux-x86_64.tar.gz
解压:
调整配置:kibana.yml
#配置本机ip及端口
server.host: "192.168.2.32"
server.port: 5601
#配置es集群url
elasticsearch.url: "http://192.168.2.32:9200"
启动:
cd ./bin
nohup ./kibana &
然后就可以通过http:// 192.168.252.129:5601来访问kibana
晒一下:
如果觉得我的文章对您有用,请随意打赏。你的支持将鼓励我继续创作!