

python matplotlib库基本图形展示
-
matplotlib 为python下的一个可视化库,它提供了很好的二维甚至三维的图形展示接口。如下是matplotlib的一些基本数据实现方式
散点图
import matplotlib.pyplot as plt
import numpy as np
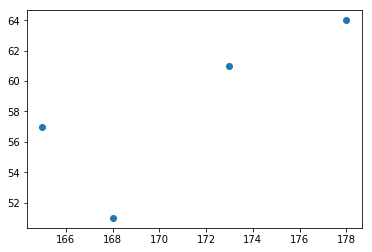
higth = [168,178,173,165]
weight = [51,64,61,57]
# 散点图绘制
plt.scatter(higth, weight)
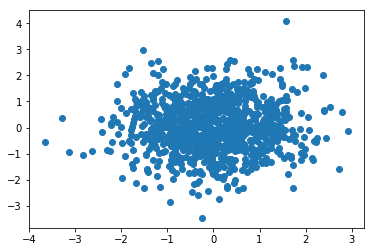
# 随机生成数据
number = 1000
x = np.random.randn(number)
y = np.random.randn(number)
# 生成离散点图
plt.scatter(x, y)
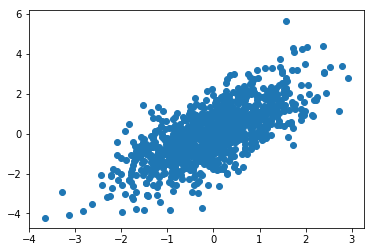
# 正相关模型
y += x
plt.scatter(x,y)
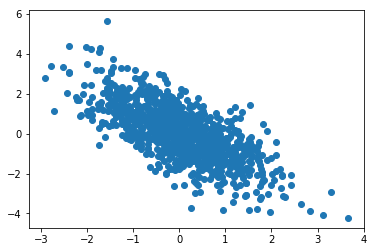
# 生成负相关线性模型
plt.scatter(-x,y,s = 10)
关于scatter 的参数(Parameters)
-
x, y : array_like, shape (n, )The data positions.
-
s : scalar or array_like, shape (n, ), optionalThe marker size in points**2.Default is
rcParams['lines.markersize'] ** 2. -
c : color, sequence, or sequence of color, optional, default: 'b'The marker color. Possible values:
-
A single color format string.
-
A sequence of color specifications of length n.
-
A sequence of n numbers to be mapped to colors using cmap andnorm.
-
A 2-D array in which the rows are RGB or RGBA.
Note that c should not be a single numeric RGB or RGBA sequencebecause that is indistinguishable from an array of values to becolormapped. If you want to specify the same RGB or RGBA value forall points, use a 2-D array with a single row.
-
-
marker :
~matplotlib.markers.MarkerStyle, optional, default: 'o'The marker style. marker can be either an instance of the classor the text shorthand for a particular marker.See~matplotlib.markersfor more information marker styles. -
cmap :
~matplotlib.colors.Colormap, optional, default: NoneA.Colormapinstance or registered colormap name. cmap is onlyused if c is an array of floats. IfNone, defaults to rcimage.cmap. -
norm :
~matplotlib.colors.Normalize, optional, default: NoneA.Normalizeinstance is used to scale luminance data to 0, 1.norm is only used if c is an array of floats. If None, usethe default.colors.Normalize. -
vmin, vmax : scalar, optional, default: Nonevmin and vmax are used in conjunction with norm to normalizeluminance data. If None, the respective min and max of the colorarray is used. vmin and vmax are ignored if you pass a norminstance.
-
alpha : scalar, optional, default: NoneThe alpha blending value, between 0 (transparent) and 1 (opaque).
-
linewidths : scalar or array_like, optional, default: NoneThe linewidth of the marker edges. Note: The default edgecolorsis 'face'. You may want to change this as well.If None, defaults to rcParams
lines.linewidth. -
verts : sequence of (x, y), optionalIf marker is None, these vertices will be used to constructthe marker. The center of the marker is located at (0, 0) innormalized units. The overall marker is rescaled by s.
-
edgecolors : color or sequence of color, optional, default: 'face'The edge color of the marker. Possible values:
-
'face': The edge color will always be the same as the face color.
-
'none': No patch boundary will be drawn.
-
A matplotib color.
For non-filled markers, the edgecolors kwarg is ignored andforced to 'face' internally.
-
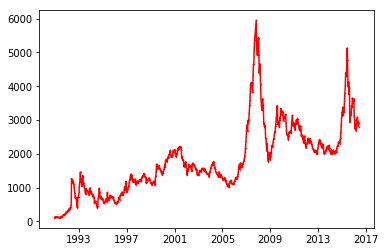
折线图
import matplotlib.dates as mdates
# 读取数据,data:日期,open:开盘价格,收盘价格,
# 其中日期需要格式化为 float 类型
data,open,close = np.loadtxt('../dataset/money.csv',
                             delimiter=',',
                             converters={0:mdates.strpdate2num('%Y/%m/%d')},
                             encoding='utf-8',
                             usecols=(0,1,3),unpack=True)
# plot_date(data,open) 默认为散点图,
# 可自动识别float 类型的 data数据,并把它转换为日期
plt.plot_date(data[::8],open[::8],'-',color='r',marker = 'o',markersize = '0.5')
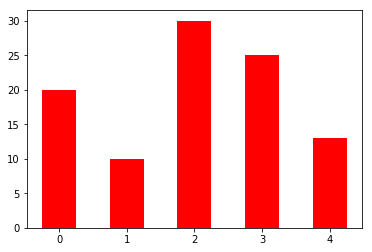
条形图
import matplotlib.pyplot as plt
import numpy as np
N = 5
y = [20,10,30,25,13]
index = np.arange(N)
plt.bar(left= index,height = y,color = 'red',width = 0.5,)
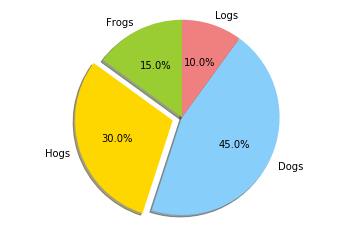
饼状图
# The silces will be ordered and plotted counter-clockwise.
labels = 'Frogs', 'Hogs', 'Dogs', 'Logs' # 定义标签
# 每一块的比例
sizes = [15,30,45,10]
# 指定颜色
colors = ['yellowgreen', 'gold', 'lightskyblue', 'lightcoral']
# 突出显示,这里仅显示第二块
explode = (0, 0.1, 0, 0)
plt.pie(sizes, explode = explode, labels = labels, colors = colors, autopct = '%1.1f%%', shadow = True, startangle = 90)
plt.axis('equal') # 显示为园(避免比列压缩为椭圆)
plt.show()
饼状图参数(Parameters)
-
x : array-like
-
The wedge sizes.
-
-
explode : array-like, optional, default: None
-
If not None, is a
len(x)array which specifies the fractionof the radius with which to offset each wedge.
-
-
labels : list, optional, default: None
-
A sequence of strings providing the labels for each wedge
-
-
colors : array-like, optional, default: None
-
A sequence of matplotlib color args through which the pie chartwill cycle. If None, will use the colors in the currentlyactive cycle.
-
-
autopct : None (default), string, or function, optional
-
If not None, is a string or function used to label the wedgeswith their numeric value. The label will be placed inside thewedge. If it is a format string, the label will be
fmt%pct.If it is a function, it will be called.
-
-
pctdistance : float, optional, default: 0.6
-
The ratio between the center of each pie slice and the start ofthe text generated by autopct. Ignored if autopct is None.
-
-
shadow : bool, optional, default: False
-
Draw a shadow beneath the pie.
-
-
labeldistance : float, optional, default: 1.1
-
The radial distance at which the pie labels are drawn
-
-
startangle : float, optional, default: None
-
If not None, rotates the start of the pie chart by angledegrees counterclockwise from the x-axis.
-
-
radius : float, optional, default: None
-
The radius of the pie, if radius is None it will be set to 1.
-
-
counterclock : bool, optional, default: True
-
Specify fractions direction, clockwise or counterclockwise.
-
-
wedgeprops : dict, optional, default: None
-
Dict of arguments passed to the wedge objects making the pie.
-
For example, you can pass in
wedgeprops = {'linewidth': 3}to set the width of the wedge border lines equal to 3. -
For more details, look at the doc/arguments of the wedge object.By default
clip_on=False.
-
-
textprops : dict, optional, default: None
-
Dict of arguments to pass to the text objects.
-
-
center : list of float, optional, default: (0, 0)
-
Center position of the chart. Takes value (0, 0) or is a sequenceof 2 scalars.
-
-
frame : bool, optional, default: False
-
Plot axes frame with the chart if true.
-
-
rotatelabels : bool, optional, default: False
-
Rotate each label to the angle of the corresponding slice if true.
-
