社区微信群开通啦,扫一扫抢先加入社区官方微信群

社区微信群
实时反馈系统运行状态,保证业务持续性进行
监控维度:
| 硬件监控 | 温度,硬件故障等 |
|---|---|
| 系统监控 | CPU,内存,硬盘,网卡流量,TCP状态,进程数 |
| 应用监控 | Nginx、Tomcat、PHP、MySQL、Redis等 |
| 日志监控 | 系统日志、服务日志、访问日志、错误日志 |
| 安全监控 | WAF,敏感文件监控 |
| API监控 | 可用性,接口请求,响应时间 |
| 业务监控 | 例如电商网站,每分钟产生多少订单、注册多少用户、多少活跃用户、推广活动效果 |
| 流量分析 | 根据流量获取用户相关信息,例如用户地理位置、某页面访问状况、页面停留时间等 |
Prometheus(普罗米修斯)是一个最初在SoundCloud上构建的监控系统。自2012年成为社区开源项目,
拥有非常活跃的开发人员和用户社区。为强调开源及独立维护,Prometheus于2016年加入云原生云计算
基金会(CNCF),成为继Kubernetes之后的第二个托管项目。
https://prometheus.io
https://github.com/prometheus
Prometheus 特点:
| 多维数据模型:由度量名称和键值对标识的时间序列数据 |
|---|
| PromSQL: 一种灵活的查询语言,可以利用多维数据完成复杂的查询 |
| 不依赖分布式存储,单个服务器节点可直接工作 |
| 基于HTTP的pull方式采集时间序列数据 |
| 推送时间序列数据通过PushGateway组件支持 |
| 通过服务发现或静态配置发现目标 |
| 多种图形模式及仪表盘支持(grafana) |
架构图:
组件说明:
| Prometheus Server | 收集指标和存储时间序列数据,并提供查询接口 |
|---|---|
| ClientLibrary | 客户端库 |
| Push Gateway | 短期存储指标数据。主要用于临时性的任务 |
| Exporters | 采集已有的第三方服务监控指标并暴露metrics |
| Alertmanager | 告警 |
| Web UI | 简单的Web控制台 |
prometheus安装: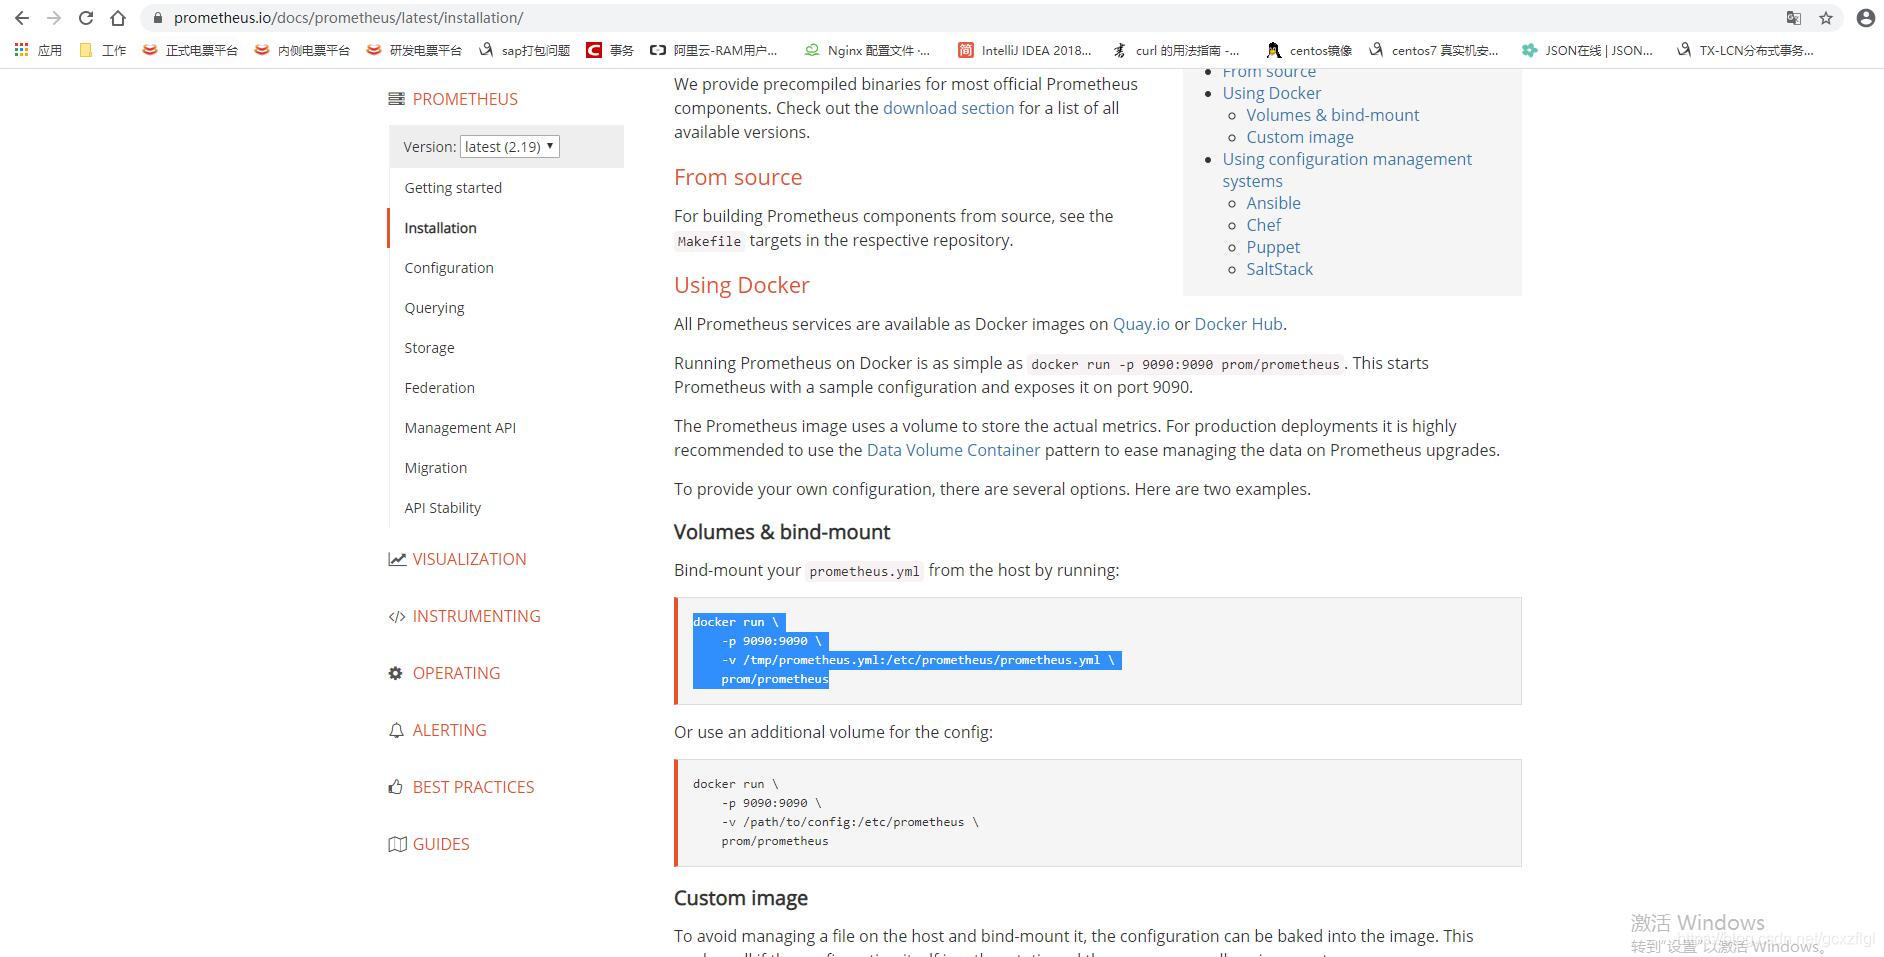
prometheus配置文件:
# my global config
global:
  scrape_interval:     15s # Set the scrape interval to every 15 seconds. Default is every 1 minute.
  evaluation_interval: 15s # Evaluate rules every 15 seconds. The default is every 1 minute.
  # scrape_timeout is set to the global default (10s).

# Alertmanager configuration
alerting:
  alertmanagers:
  - static_configs:
    - targets:
      # - alertmanager:9093

# Load rules once and periodically evaluate them according to the global 'evaluation_interval'.
rule_files:
  # - "first_rules.yml"
  # - "second_rules.yml"

# A scrape configuration containing exactly one endpoint to scrape:
# Here it's Prometheus itself.
scrape_configs:
  # The job name is added as a label `job=<job_name>` to any timeseries scraped from this config.
  - job_name: 'prometheus'

    # metrics_path defaults to '/metrics'
    # scheme defaults to 'http'.

    static_configs:
    - targets: ['localhost:9090']
访问地址:http://192.168.98.90:9090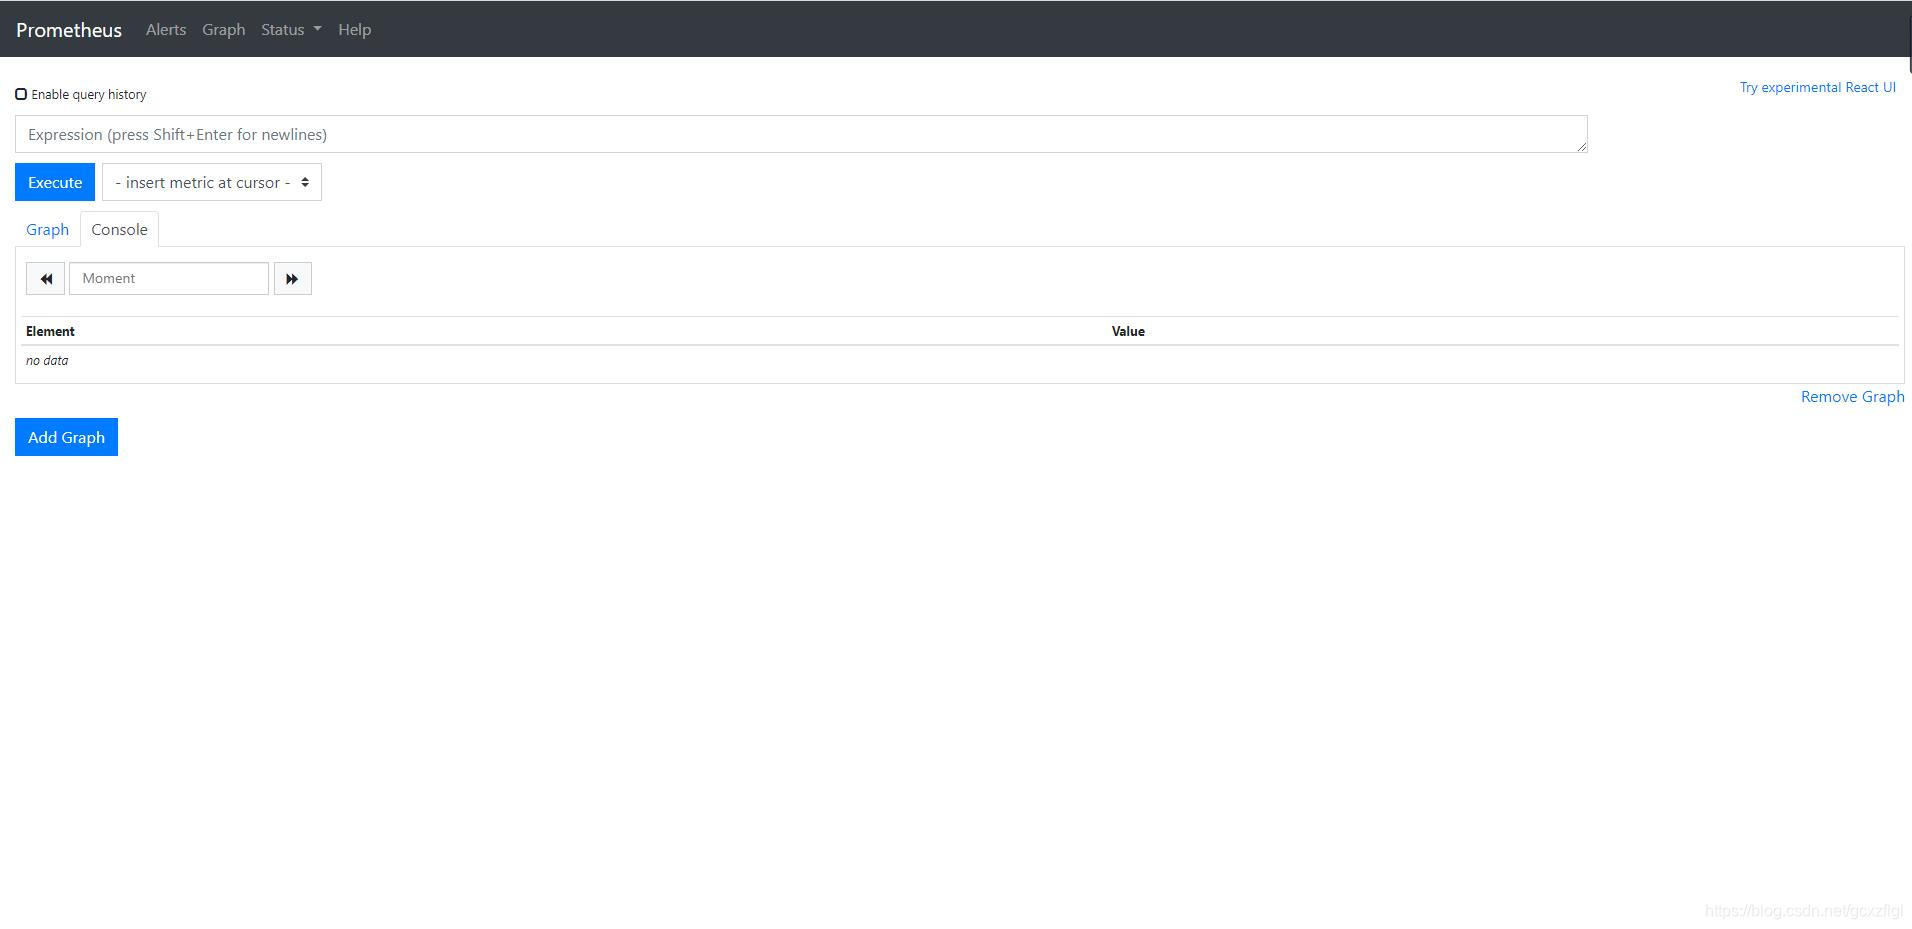
用于收集正在运行的容器资源使用情况
github:https://github.com/google/cadvisor
Cadvisor安装: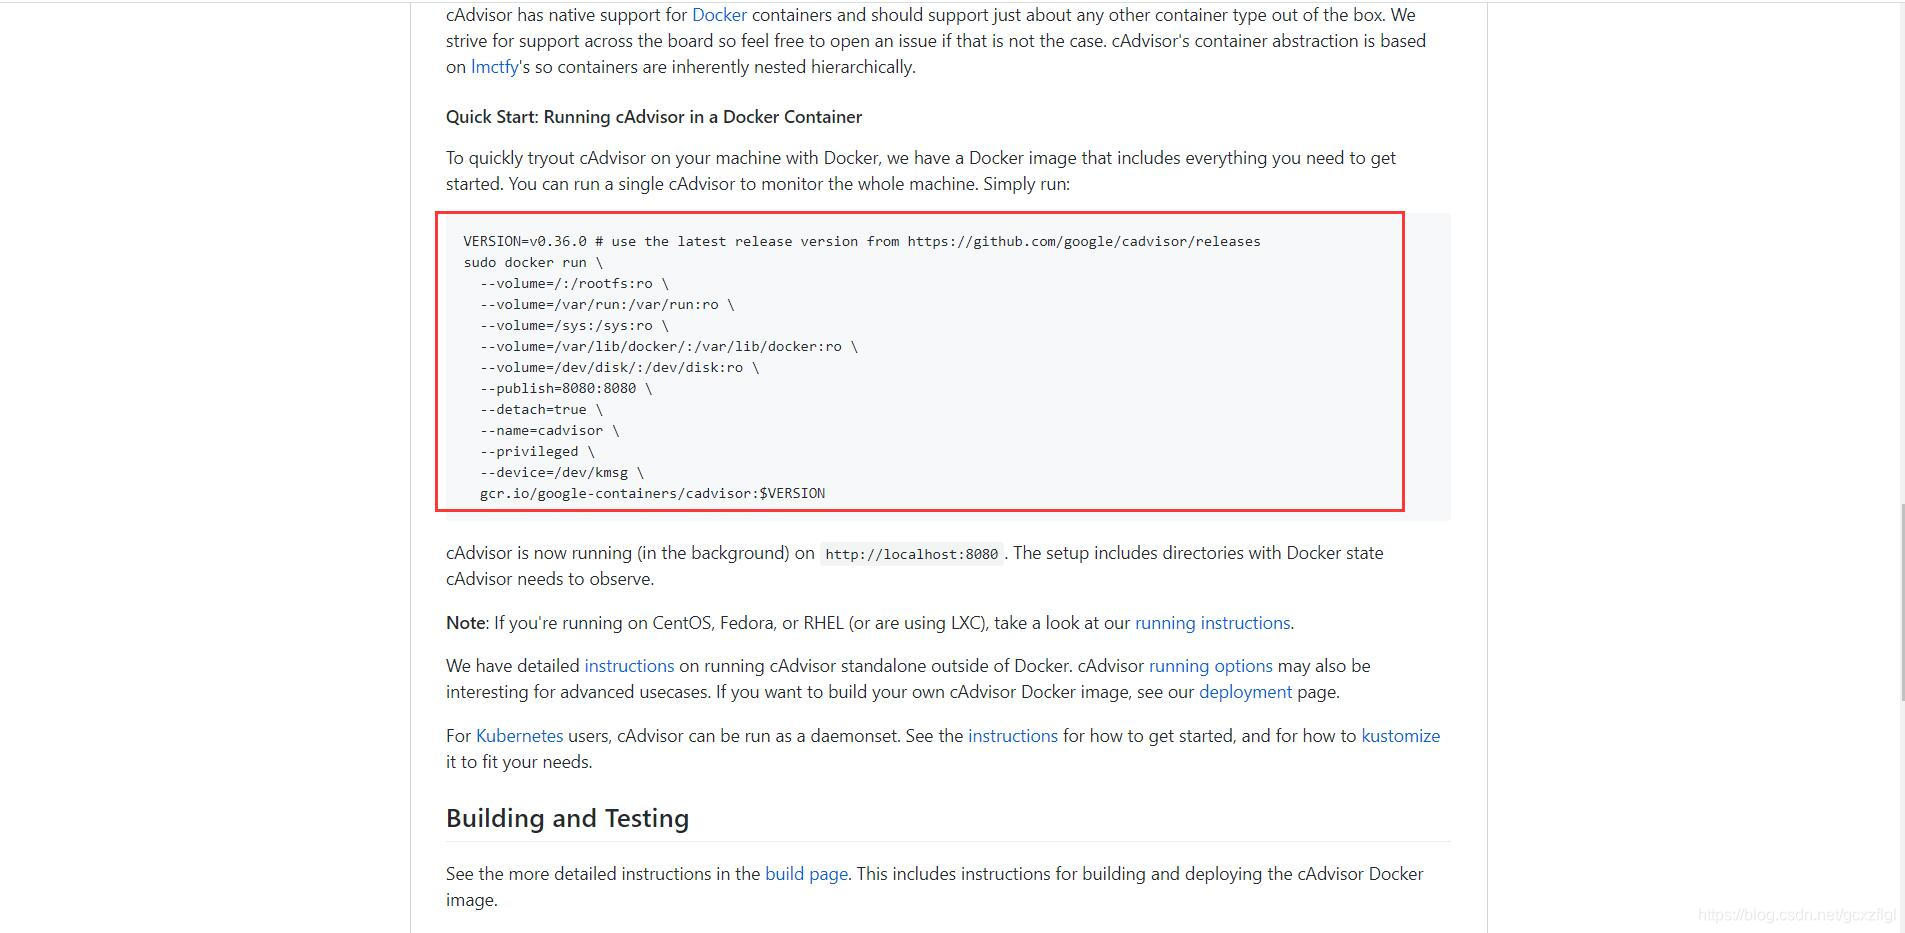
访问地址:http://192.168.98.90:8080/containers/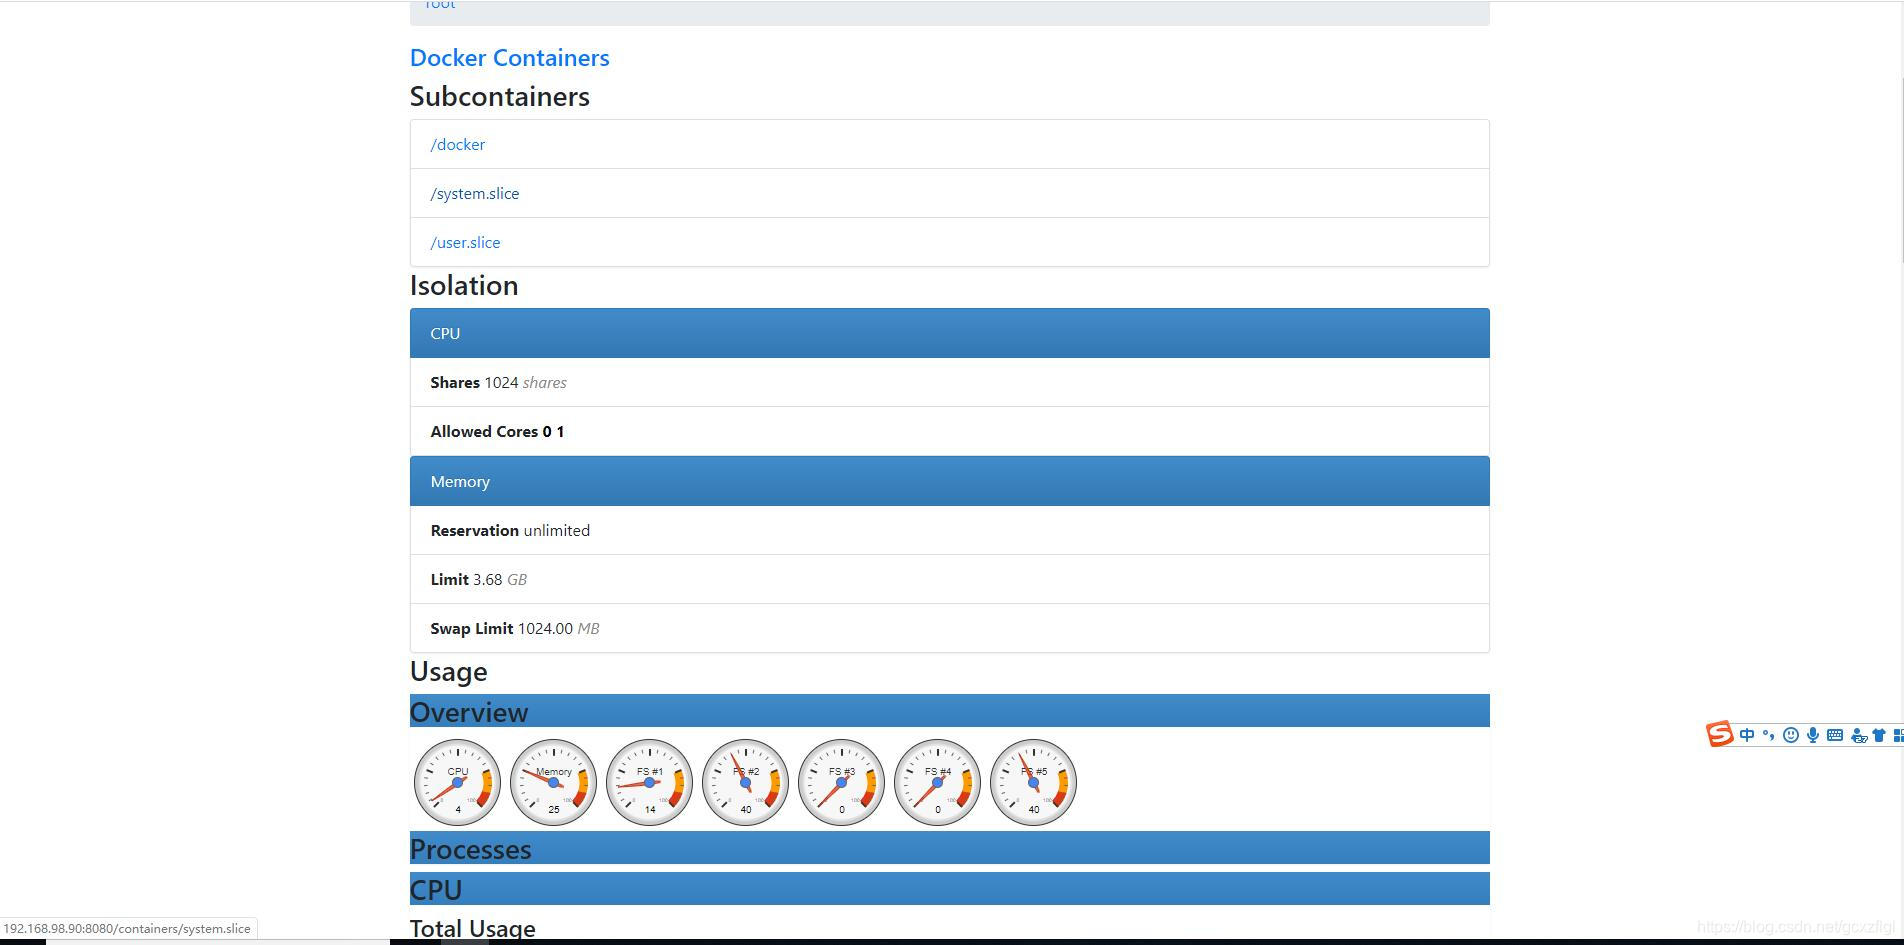
Grafana是一个跨平台的开源的度量分析和可视化工具,可以通过将采集的数据查询然后可视化的展示,并及时通知
Grafana安装:
https://grafana.com/grafana/download?platform=docker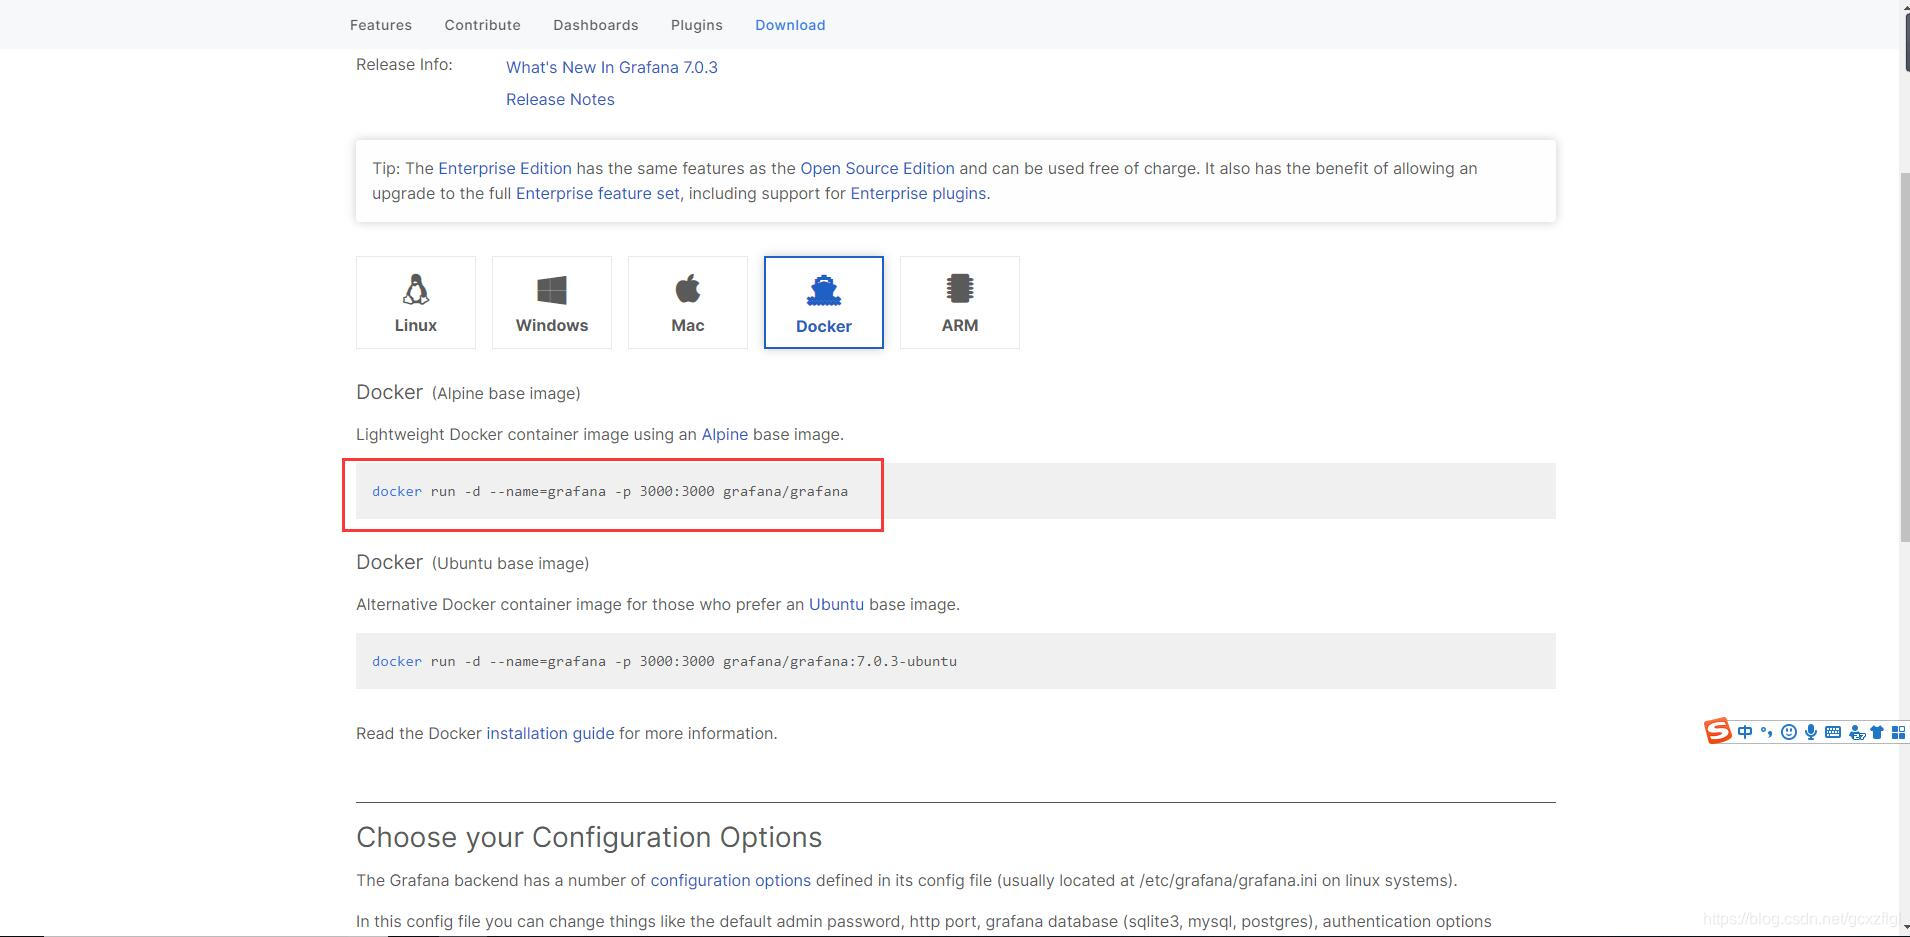
1)更新配置prometheus.yml配置文件
	#Cadvisor配置地址
  - job_name: 'docker'
    static_configs:
    - targets: ['192.168.98.90:8080']
2)重启prometheus看到能看到container*的采集标本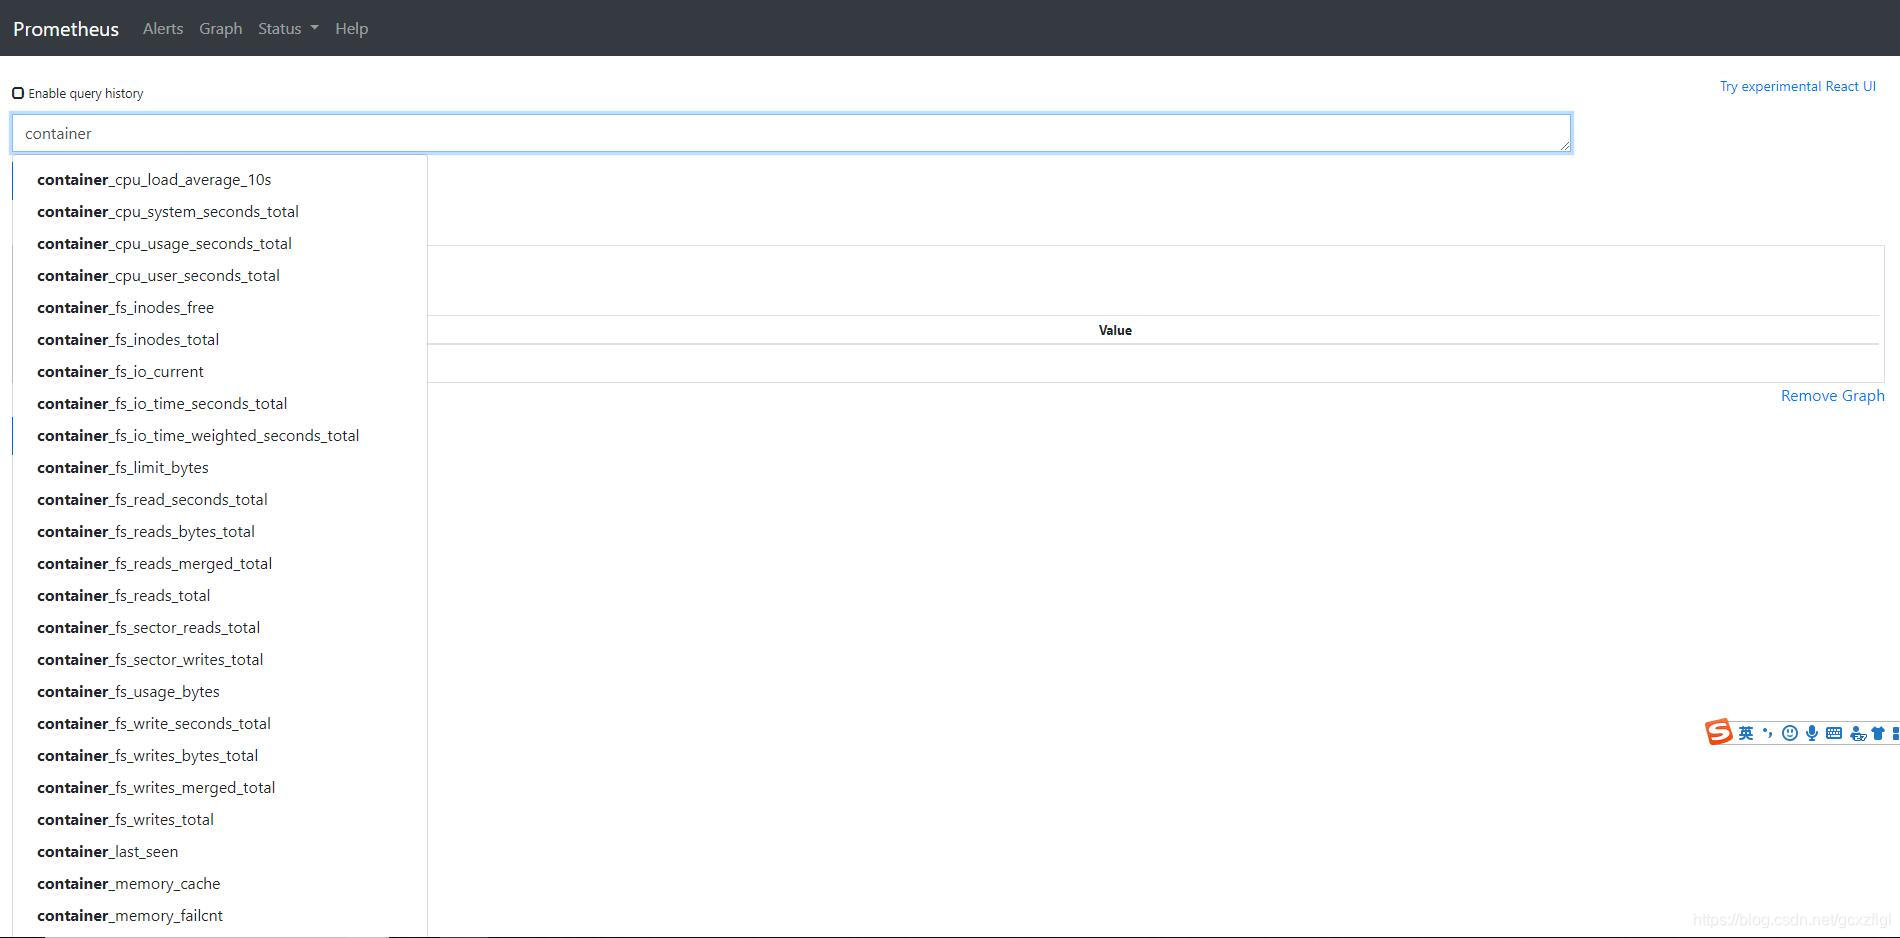
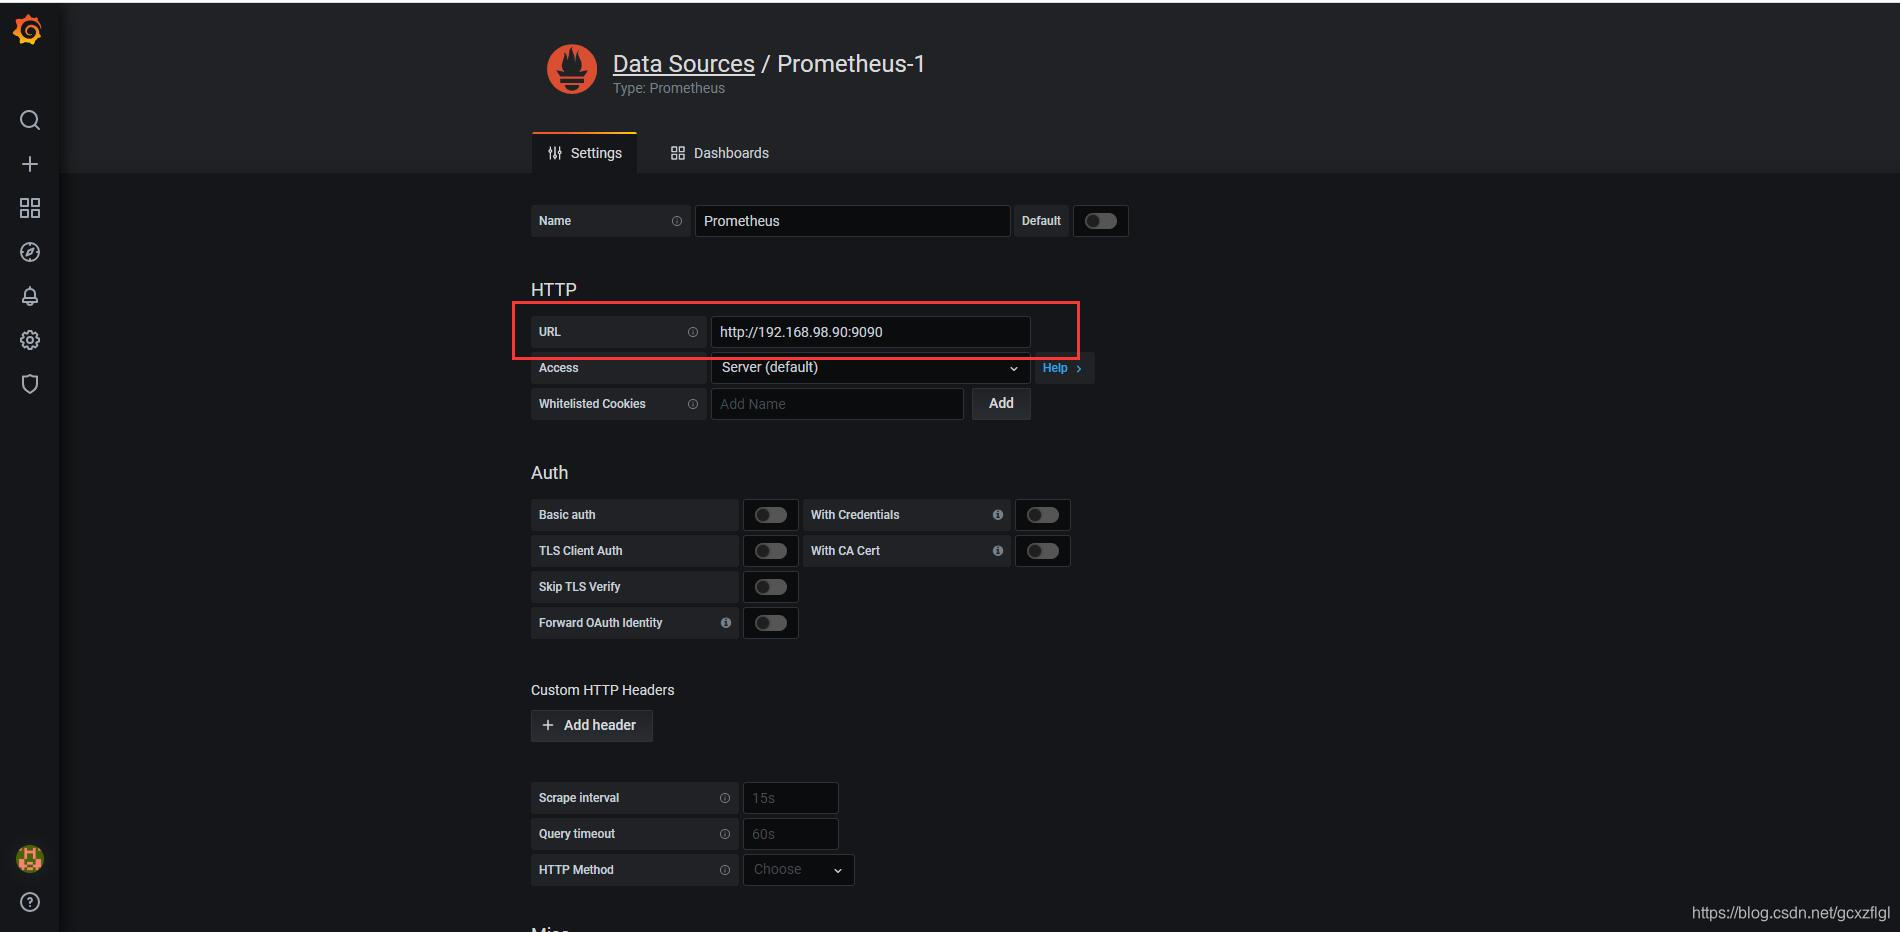
3) Grafana配置数据源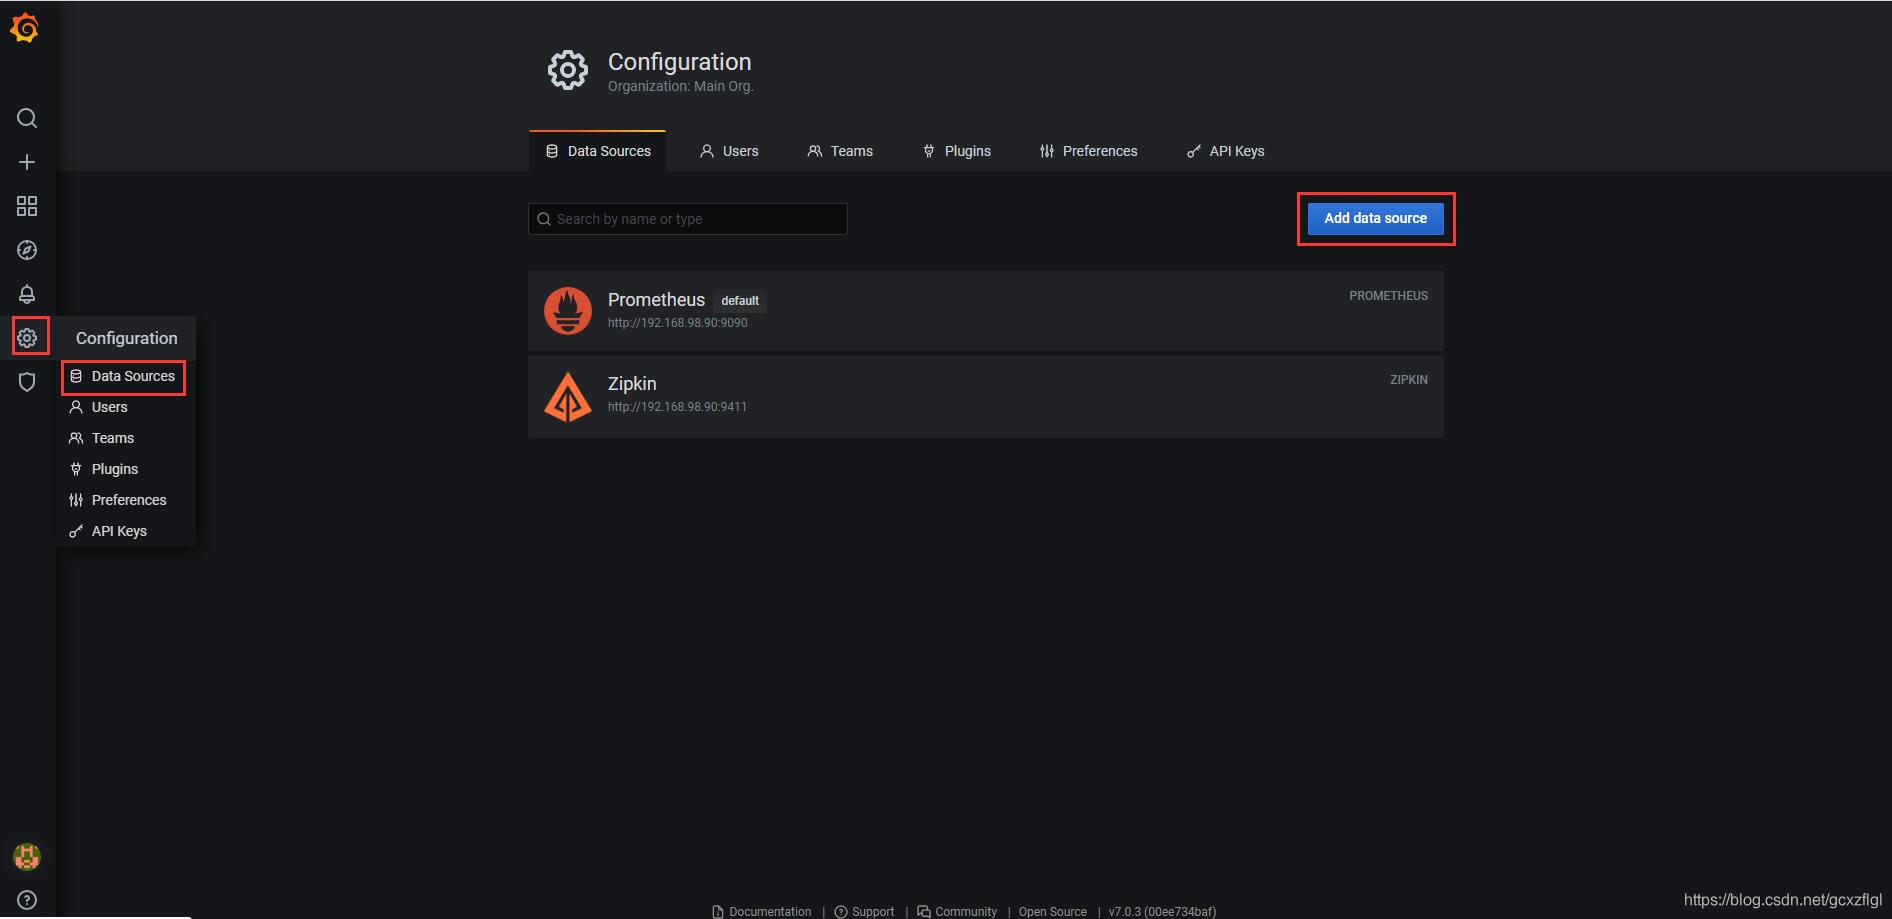
4)导入别人制作好的模板,输入模板id https://grafana.com/grafana/dashboards?orderBy=name&direction=asc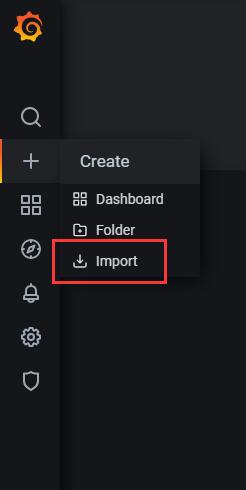
5) 展示docker运行容器资源状况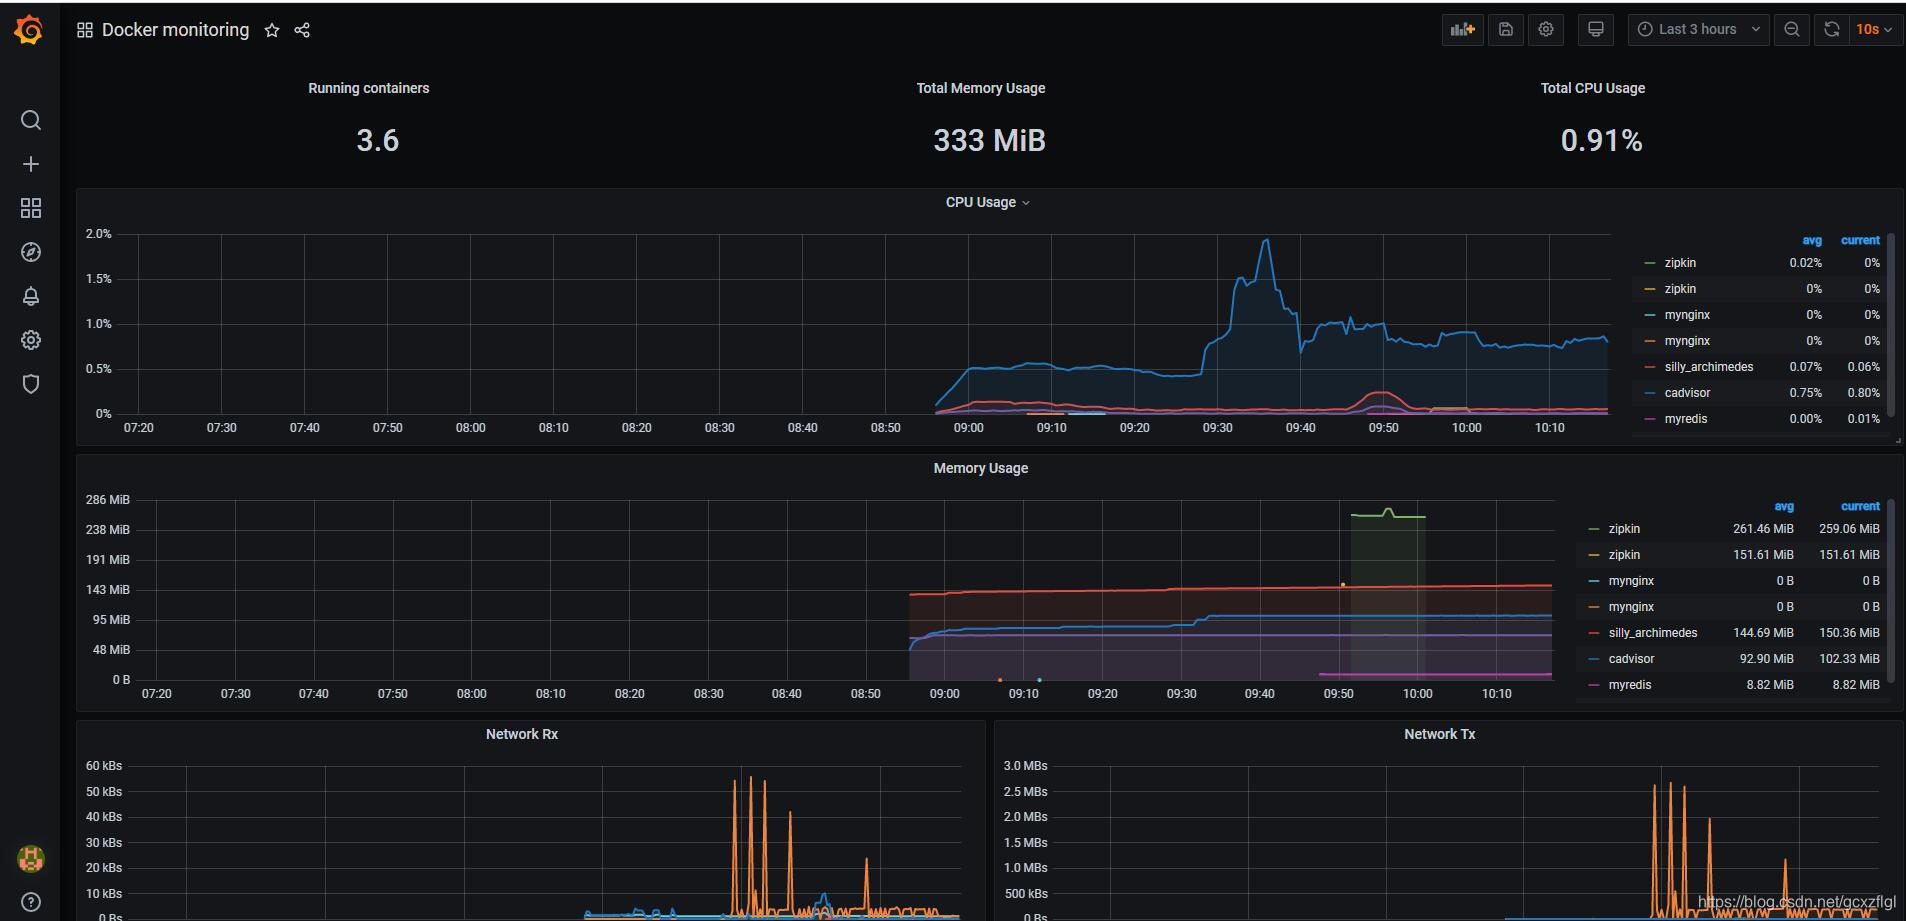
至此,基本演示完毕。更多内容后续更新!
如果觉得我的文章对您有用,请随意打赏。你的支持将鼓励我继续创作!
