社区微信群开通啦,扫一扫抢先加入社区官方微信群

社区微信群
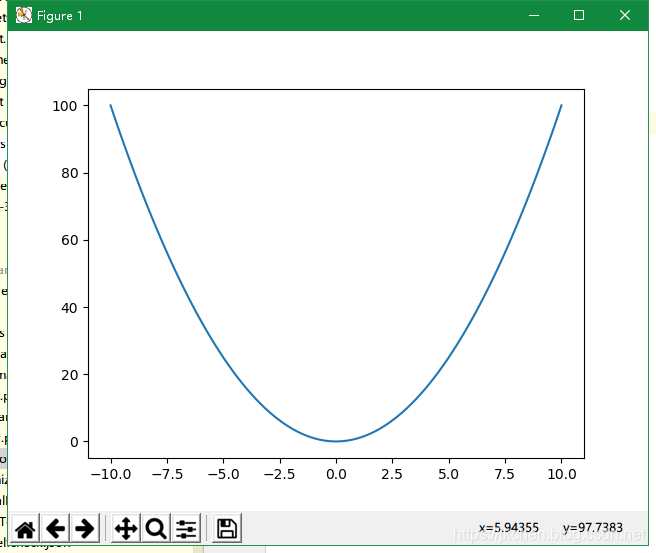
import matplotlib.pyplot as plt
import numpy as np

x = np.linspace(-10, 10, 100) # 产生-10到10的100个点
y = x**2
plt.plot(x, y)
plt.show()
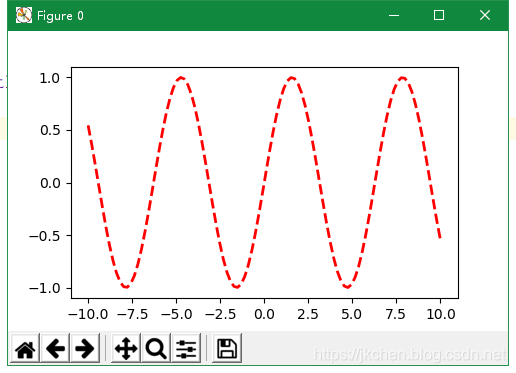
import matplotlib.pyplot as plt
import numpy as np
x = np.linspace(-10, 10, 100)
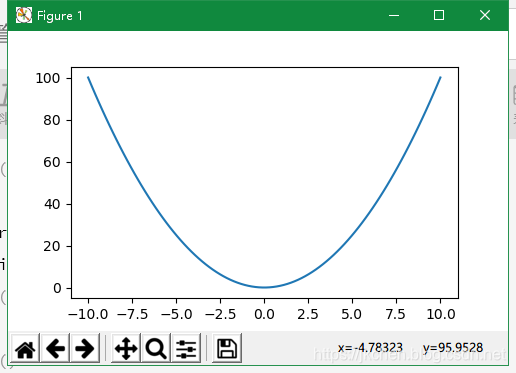
plt.figure(num=1,figsize=(5,3))
y = x**2
plt.plot(x, y)
plt.figure(num=0,figsize=(5,3))
y = np.sin(x)
plt.plot(x, y,color="red",linewidth=2,linestyle='--')
plt.show()
import matplotlib.pyplot as plt
import numpy as np
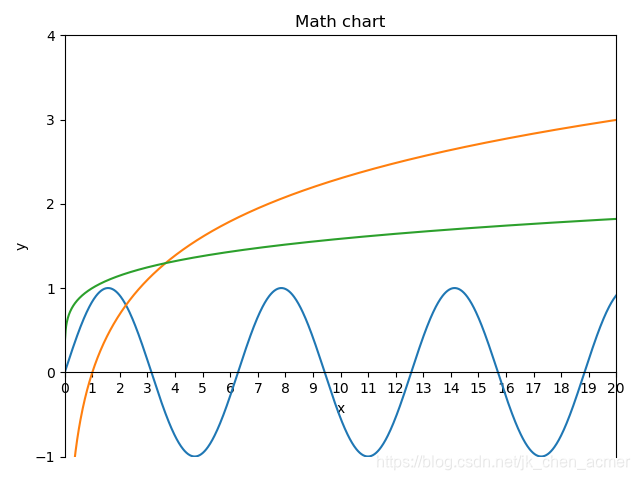
fig = plt.figure()
ax = fig.add_subplot(1,1,1) #分成1*1,占用第1格
ax.set(xlim=[0, 20], ylim=[-1, 4], title='Math chart',
ylabel='y', xlabel='x')
new_ticks=np.linspace(0,20,21) #[0,20]用21个刻度
plt.xticks(new_ticks)
new_ticks=np.linspace(-1,4,6) #[-1,4]用6个刻度
plt.yticks(new_ticks)
ax.xaxis.set_ticks_position('bottom')
ax.spines['bottom'].set_position(('data',0)) #x轴:y=0
ax.yaxis.set_ticks_position('left')
ax.spines['left'].set_position(('data',0)) #y轴:x=0
x = np.linspace(0.01,20,1000)
# (0.01,20)范围放1000个点
y1 = np.sin(x) # 函数y=sin(x)
y2 = np.log(x) # 函数y=log(x)
y3 = x**0.2 # 函数y=x^0.2
ax.plot(x, y1)
ax.plot(x, y2)
ax.plot(x, y3)
plt.show()
plt.parse(0.1)是至少0.1s的意思,如果0.1s内有其它的plt.parse()会延后。否则0.1s后会保留这张图。
plt.ion() # 之后才能plt.pause(t)

for i in range(100):
	plt.cla() # 清空之前的
	plt.parse(0.1) # 显示0.1秒
plt.close() # 关闭

plt.ioff() #ioff后才能show()
name='result.png'
plt.savefig(name)
import numpy as np
import matplotlib.pyplot as plt
from matplotlib import animation

fig, ax = plt.subplots()

x = np.arange(0, 2*np.pi, 0.01)
line, = ax.plot(x, np.sin(x))

def animate(i):
    line.set_ydata(np.sin(x + i/10.0))
    return line,

def init():
    line.set_ydata(np.sin(x))
    return line,

ani = animation.FuncAnimation(fig=fig, func=animate, frames=10000, init_func=init,
                              interval=20, blit=True)

plt.show()
Pycharm动画显示不了:
Setting -> Python Scientific -> show in … 去掉勾
如果觉得我的文章对您有用,请随意打赏。你的支持将鼓励我继续创作!
