Prometheus监控实践:使用Prometheus监控Java应用 - Go语言中文社区

Prometheus监控实践:使用Prometheus监控Java应用


之前在《Prometheus监控实践:Kubernetes集群监控》一本中总结了我们目前基于Prometheus对Kubernetes集群的监控,除了监控Kubernetes集群本身的关键指标之外,也对部署在Kubernetes集群上应用的状态做了监控。 对于Kubernetes集群上Pod, DaemonSet, Deployment, Job, CronJob等各种资源对象,我们通过kube-state-metrics作为Prometheus的exporter完成了对这些Kubernetes资源对象的监控。而为了使监控深入到应用的内部,就需要应用自身暴露作为Exporter暴露监控指标,这就和应用的开发语言和技术框架紧密相关了。

我们目前部署在Kubernetes上的微服务主要是由Go和Java两种语言开发的,本篇将总结一下目前我们使用Prometheus对Java应用的监控实践。

Prometheus JVM Client

Prometheus提供了一个client_java项目可以很方便的将JVM和自定义的指标暴露出来。目前我们主要用到了这个项目中的如下几个库:

  • simpleclient_hotspot
  • simpleclient_spring_web
  • simpleclient_spring_boot
  • simpleclient_httpserver

使用Java可以开发以下两种服务:

第一种是使用spring-boot-starter-web开发的HTTP Restful API,这类服务要集成Prometheus十分简单,只需要在项目中依赖管理如引入simpleclient_hotspotsimpleclient_spring_boot

1
2
compile 'io.prometheus:simpleclient_spring_boot:0.1.0'
compile 'io.prometheus:simpleclient_hotspot:0.1.0'

simpleclient_spring_boot中的io.prometheus.client.spring.boot.PrometheusEndpointConfiguration会将prometheus exporter注册为Spring Boot Actuator的enpoint。启动这个配置只需在spring boot项目的Appication类上加上@EnablePrometheusEndpoint的注解,例如:

1
2
3
4
5
6
7
8
9
@EnablePrometheusEndpoint
@EnableSpringBootMetricsCollector
@SpringBootApplication
public class BootApplication {
    @PostConstruct
	public void init() {
		DefaultExports.initialize();
	}
    ......

当然spring boot的配置文件中需要配置如何暴露这个endpoint:

 1
 2
 3
 4
 5
 6
 7
 8
 9
10
11
12
13
14
15
management:
  port: 8088
  security:
    enabled: false
  health:
    defaults:
      enabled: false
endpoints:
  enabled: false
  prometheus:
    enabled: true
    path: /prometheus
  health:
    enabled: true
    path: /health

此时http://:8088/prometheus这个端点就是这个Java应用暴露的监控指标。

第二种是使用最基本的spring-boot-starter和其他starter开发的rpc服务(thrift,gRPC等),本身不包含嵌入的tomcat,而Prometheus的exporter需要以HTTP暴露监控指标。需要在项目中依赖管理如引入simpleclient_hotspotsimpleclient_httpserver

1
2
compile 'io.prometheus:simpleclient_httpserver:0.1.0'
compile 'io.prometheus:simpleclient_hotspot:0.1.0'

simpleclient_httpserver库包含一个简单的httpserver,使用其完成监控指标的暴露:

1
2
DefaultExports.initialize();
new io.prometheus.client.exporter.HTTPServer.HTTPServer(8088);

http://:8088这个端点就是这个Java应用暴露的监控指标。

Prometheus的服务发现

当Java应用中集成了Prometheus JVM Client后,就可以以HTTP的形式暴露监控指标。 如果Java应用以Pod的形式部署在Kubernetes集群上,为了使Kubernetes集群中的Prometheus可以发现Pod暴露的HTTP监控端点,还需要在Kubernetes manifest文件中加入下面的annotation:

 1
 2
 3
 4
 5
 6
 7
 8
 9
10
11
12
13
14
15
16
17
18
19
20
21
22
23
24
---
kind: Deployment
apiVersion: apps/v1beta2
metadata:
  labels:
    ......
  name: xxx-svc
  namespace: xx
spec:
 ......
  selector:
    matchLabels:
      app: xxx-svc
  template:
    metadata:
      labels:
        app: xxx-svc
      annotations:
        prometheus.io/scrape: 'true'
        prometheus.io/path: /prometheus
        prometheus.io/port: '8088'
    spec:
      containers:
      ......

这样Prometheus中配置的job kubernetes-pods就可以自动发现服务暴露的监控端点:

 1
 2
 3
 4
 5
 6
 7
 8
 9
10
11
12
13
14
15
16
17
18
19
20
21
22
23
24
- job_name: 'kubernetes-pods'
      kubernetes_sd_configs:
      - role: pod
      relabel_configs:
      - source_labels: [__meta_kubernetes_pod_annotation_prometheus_io_scrape]
        action: keep
        regex: true
      - source_labels: [__meta_kubernetes_pod_annotation_prometheus_io_path]
        action: replace
        target_label: __metrics_path__
        regex: (.+)
      - source_labels: [__address__, __meta_kubernetes_pod_annotation_prometheus_io_port]
        action: replace
        regex: ([^:]+)(?::d+)?;(d+)
        replacement: $1:$2
        target_label: __address__
      - action: labelmap
        regex: __meta_kubernetes_pod_label_(.+)
      - source_labels: [__meta_kubernetes_namespace]
        action: replace
        target_label: kubernetes_namespace
      - source_labels: [__meta_kubernetes_pod_name]
        action: replace
        target_label: kubernetes_pod_name

Grafana Dashboard和告警规则

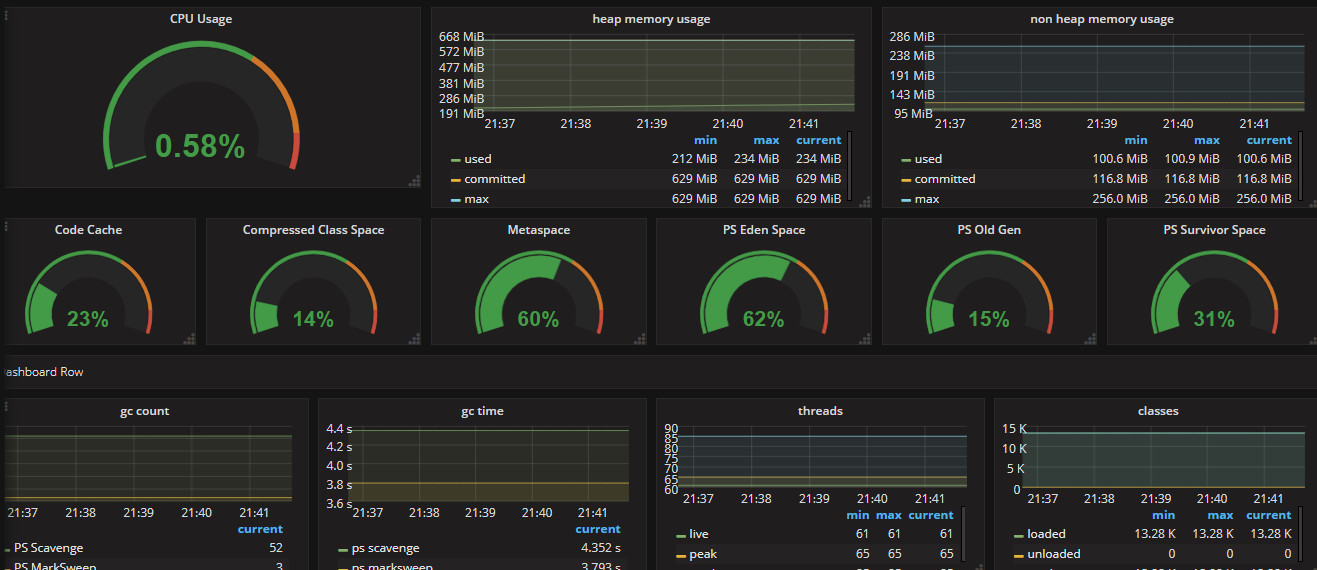
关于Java应用中JVM的监控的Dashboard,目前还没有在网上找到太好的,下图是目前我们自己画的一个:

java-grafana.jpg

收集到了监控数据后,告警规则根据需要配置就可以了。

参考

转载于:https://my.oschina.net/xiaominmin/blog/3066645

版权声明:本文来源CSDN,感谢博主原创文章,遵循 CC 4.0 by-sa 版权协议,转载请附上原文出处链接和本声明。
原文链接:https://blog.csdn.net/chuxiong5717/article/details/100827849
站方申明:本站部分内容来自社区用户分享,若涉及侵权,请联系站方删除。
  • 发表于 2020-03-01 20:57:57
  • 阅读 ( 1408 )
  • 分类:Go应用

0 条评论

请先 登录 后评论

官方社群

GO教程

猜你喜欢