
Data visualization is an important skill to possess for anyone trying to extract and communicate insights from data. In the field of machine learning, visualization plays a key role throughout the entire process of analysis.
对于任何试图从数据中提取和传达见解的人来说,数据可视化都是一项重要技能。 在机器学习领域,可视化在整个分析过程中都扮演着关键角色。
Why do we need to visualize the data?
为什么我们需要可视化数据?
Let’s say, we have data set of Car Sales across four continents in the first 11 months.
假设我们在前11个月拥有四大洲的汽车销售数据集。
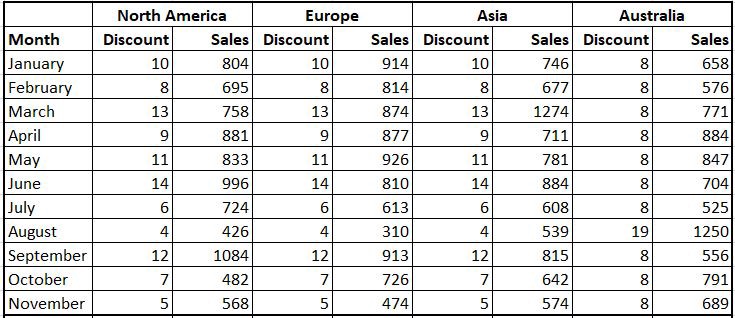
It is pretty cumbersome to analyze each column separately and draw some conclusions by the above data. So, what we generally do is, summarize the data and deduce some insights from it. Now, let’s see how the sales have performed in each continent when compared to others, for that, we’ll calculate the average of Discount and Sales for each continent,
分别分析各列并根据上述数据得出一些结论是非常麻烦的。 因此,我们通常要做的是汇总数据并从中得出一些见解。 现在,让我们看看与其他大陆相比,每个大陆的销售情况如何,为此,我们将计算每个大陆的折扣和销售平均值,
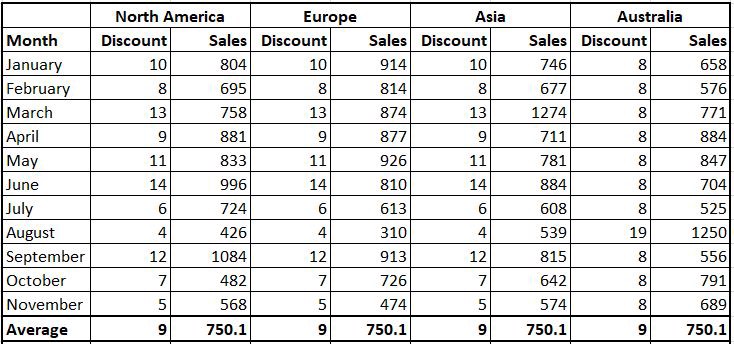
It looks like the Sales have been pretty equal across the continents for the first 11 months. Let’s also take a look at the Standard Deviation of each column by further inspecting the data,
前11个月,各大洲的销售情况似乎相当。 让我们通过进一步检查数据来查看每列的标准差,
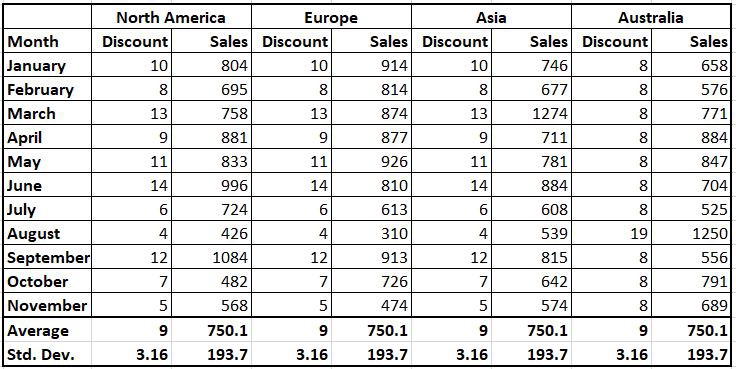
So, by the above data, we can infer that the performance of the sales has been the same when compared to the continents. See, this is where the summary statistics tend to mislead.
因此,根据以上数据,我们可以推断出与各大洲相比,销售业绩是相同的。 瞧,这就是汇总统计数据容易引起误解的地方。
If we plot the Sales performance across the Discount rate from the above data in Python on a scatter plot, we get the following graphs.
如果我们根据散点图上Python中上述数据在折现率上绘制Sales性能,则会得到以下图形。
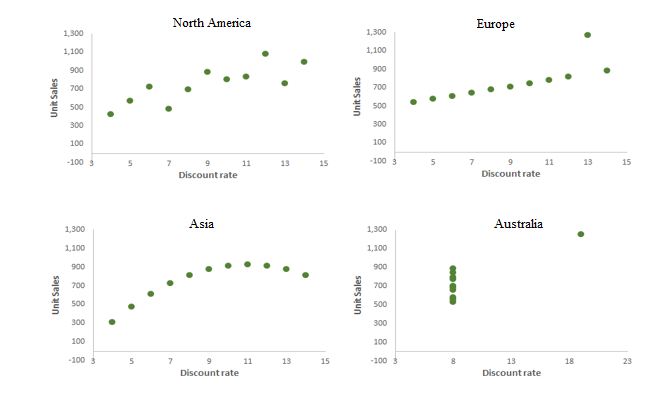
Each of the continents had employed a different strategy to boost their sales and their discount rate, and the sales numbers were also quite different across all of them. It is difficult to understand the pattern or the strategy of each of the continents using the numbers alone. So, that’s why it is important to Visualize the data instead of drawing the conclusions based on only numbers.
每个大洲都采用了不同的策略来提高销售量和折扣率,并且所有销售量的差异也很大。 仅凭数字很难理解每个大洲的格局或战略。 因此,这就是为什么要可视化数据而不是仅基于数字得出结论很重要的原因。
The above data-set is a modified version of Anscombe’s quartet, they were constructed in 1973 by the statistician Francis Anscombe, to counter the impression among statisticians that “numerical calculations are exact, but graphs are rough.”
上面的数据集是Anscombe四重奏的修改版本,它们是由统计学家Francis Anscombe于1973年构建的,目的是抵消统计学家的印象,即“数值计算是精确的,但图形是粗糙的”。
You can find more about Anscombe’s quartet here.
您可以在此处找到有关Anscombe四重奏的更多信息。
So, now comes the million-dollar question,
因此,现在出现了百万美元的问题,
我们应该使用哪个Python库进行数据可视化? (Which Python Library should we use for Data Visualization?)
Python has some of the most interactive data visualization tools. The most basic plot types are shared between multiple libraries, but others are only available in certain libraries.
Python具有一些最具交互性的数据可视化工具。 最基本的绘图类型在多个库之间共享,但是其他类型仅在某些库中可用。
The three main data visualization libraries used by every data scientist is:
每个数据科学家使用的三个主要的数据可视化库是:
- Matplotlib Matplotlib
- Seaborn 海生
- Plotly 密谋
1. Matplotlib (1. Matplotlib)
Matplotlib is the most popular data visualization library of Python. It is used to generate simple yet powerful visualizations. Everyone, from beginners to seasoned professionals in Data science, Matplotlib is the most widely used library for plotting.
Matplotlib是最受欢迎的Python数据可视化库。 它用于生成简单而强大的可视化。 从初学者到经验丰富的数据科学专业人士,Matplotlib是最广泛使用的绘图库。
Advantages:
优点:
- Matplotlib supports various types of graphical representations like Bar Graphs, Histograms, Line Graph, Scatter Plot, Stem Plots, etc. Matplotlib支持各种类型的图形表示,例如条形图,直方图,折线图,散点图,干图等。
- Matplotlib can be used in multiple ways including Python scripts, the Python and iPython shells, Jupyter Notebooks. Matplotlib可以多种方式使用,包括Python脚本,Python和iPython shell,Jupyter Notebooks。
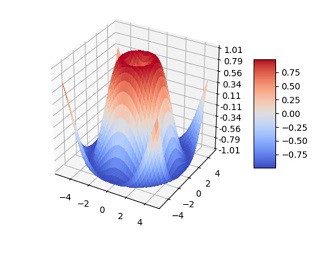
- Matplotlib is a 2-D plotting library. But there are some extensions that we can use to create advanced visualizations like 3-Dimensional plots, etc. Matplotlib是一个二维绘图库。 但是,我们可以使用一些扩展来创建高级可视化效果,例如3维图等。
2. Seaborn (2. Seaborn)
The Python library Seaborn is a data visualization library based on Matplotlib. Seaborn provides a variety of visualization patterns. It is more integrated to work with Pandas dataframe compared to matplotlib. Seaborn is widely used for statistics visualization because it has some of the best statistical tasks built with-in.
Python库Seaborn是基于Matplotlib的数据可视化库。 Seaborn提供了多种可视化模式。 与matplotlib相比,它与Pandas数据框的集成度更高。 Seaborn被广泛用于统计可视化,因为它具有一些内置的最佳统计任务。
Advantages:
优点:
- Seaborn uses fewer Syntax and we write less code to achieve high-grade visualizations. Seaborn使用的语法更少,我们编写的代码更少,可以实现高级可视化。
- When compared to matplolib, the seaborn graphs are much more visually appealing by default. 与matplolib相比,默认情况下,seaborn图在视觉上更具吸引力。
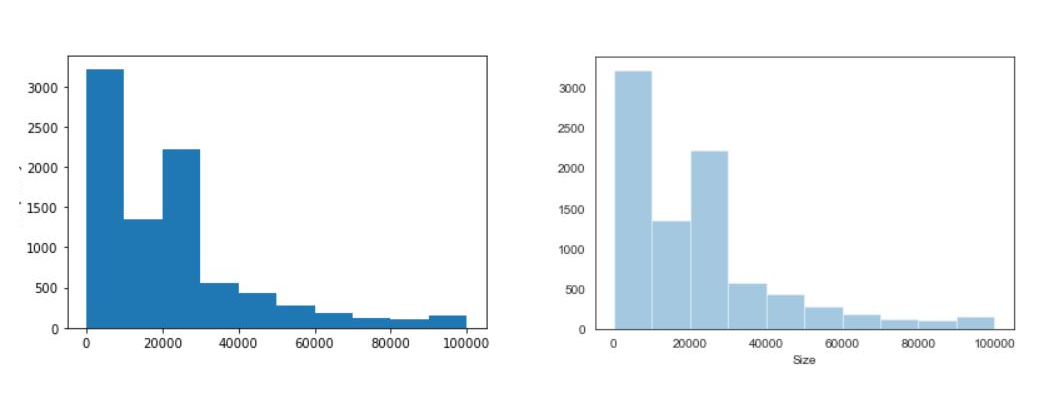
3. Seaborn works with the whole dataset as a whole compared to matplotlib which deals with dataframes and arrays.
3.与处理数据帧和数组的matplotlib相比,Seaborn可以处理整个数据集。
3.密谋 (3. Plotly)
Plotly provides interactive plots and is easily readable to an audience who doesn’t have much knowledge of reading plots. Plotly is mostly used for handing the geographical, scientific, statistical, and financial data.
Plotly提供交互式绘图,对于不了解绘图的读者很容易理解。 Plotly主要用于处理地理,科学,统计和财务数据。
Advantages:
优点:
- Plotly is highly compatible with Jupyter Notebook and Web-Browsers, which makes it easy to share the graphs with end-users. Plotly与Jupyter Notebook和Web浏览器高度兼容,这使得与最终用户轻松共享图形成为可能。
- The most important advantage is Plotly offers contour plots, which cannot be found in most libraries. 最重要的优点是Plotly提供了等高线图,这在大多数库中都找不到。
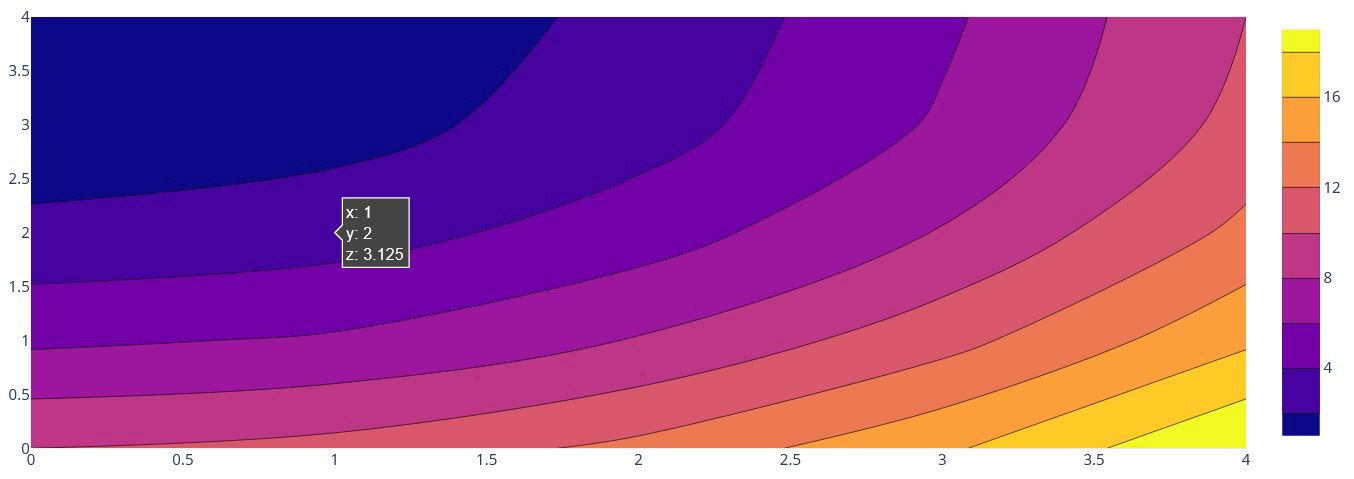
3. While using Plotly, if we mouse over on the Graph, it shows the values of the axis at that particular point.
3.使用Plotly时,如果将鼠标悬停在Graph上,它将显示该特定点处的轴值。
There are some more data visualization libraries available in Python like Bokeh, Altair, ggplot, etc. But, the ones mentioned above are the most common and widely used libraries across the world.
Python中还有更多可用的数据可视化库,例如Bokeh,Altair,ggplot等。但是,上面提到的那些是世界上最常见且使用最广泛的库。
结论 (Conclusion)
In this article first, we learned why it is important to visualize the data instead of inferring solely based on datasheets. After that, we have seen the different types of data visualization libraries in Python. There are a wide variety of data visualization tools available in Python apart from the ones discussed and mentioned above. It is important to familiarize yourself with the libraries before proceeding with a particular approach.
首先,在本文中,我们了解了为什么对数据进行可视化而不是仅基于数据表进行推断很重要。 之后,我们看到了Python中不同类型的数据可视化库。 除了上面讨论和提到的工具外,Python还提供了各种各样的数据可视化工具。 在继续使用特定方法之前,一定要熟悉这些库,这一点很重要。
Thank you for reading and Happy Coding!!!
感谢您的阅读和快乐编码!!!
在这里查看我以前有关Python的文章 (Check out my previous articles about Python here)
翻译自: https://levelup.gitconnected.com/data-visualization-and-its-importance-python-7599c1092a09
