社区微信群开通啦,扫一扫抢先加入社区官方微信群

社区微信群
性能分析是优化代码不可避免的一步。而拥有高效清晰的性能分析工具则能让我们事半功倍。
PProf就是一款Golang提供的强大代码性能分析,能够非常方便的监控代码运行性能。
这里简单的介绍pprof两种使用方式
1.net/http/pprof 包
net/http/pprof 能将信息在http端口上暴露出来,入口为 IP:PORT/debug/pprof/
若应用为web服务器,只需引入包即可 _ “net/http/pprof”,会自动注册路由到/debug/pprof/
若应用为服务时,可开启一个goroutine开启端口并监听,如
package main

import (
	"log"
	"net/http"
	_ "net/http/pprof"
	"strconv"
)

func main() {
	// 开启监听 使用pprof 性能分析
	go func() {
		log.Println(http.ListenAndServe(":8090", nil))
	}()

	// 业务代码
	for {
		TestCode("test")
	}
}

func TestCode(str string) string {
	data := []byte(str)
	sData := string(data)
	var sum = 0
	for i := 0; i < 10000; i++ {
		sum += i
	}
	sData += strconv.Itoa(sum)
	return sData
}
运行该服务 即可在http://127.0.0.1:8090/debug/pprof/上查看性能数据 如图所示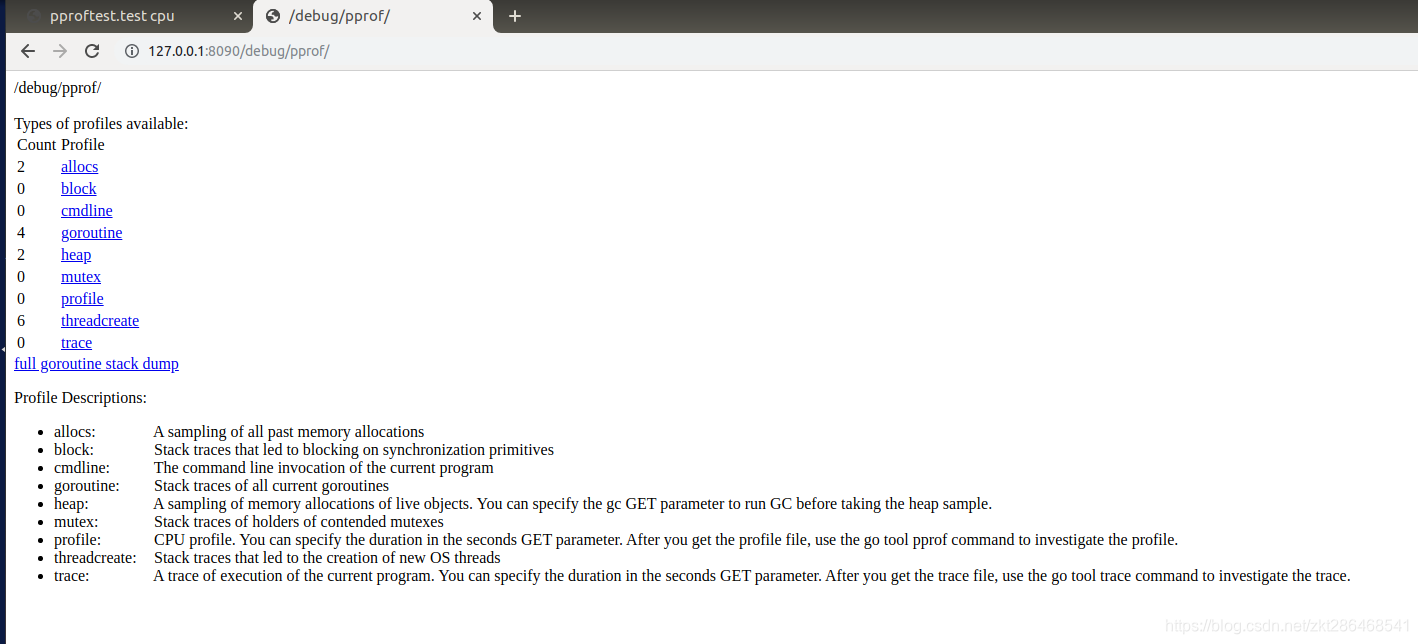
allocs 过去所有的内存分析采样
block 导致同步原语阻塞的堆栈跟踪
cmdline 当前程序的命令行调用
goroutine 当前所有goroutine堆栈跟踪
heap 活动对象内存分配采样
mutex 互斥锁跟踪
profile 生成cpuprofile文件 生成文件可以用go tool pprof工具分析
threadcreate 创建系统线程的堆栈跟踪
trace 对当前程序执行的跟踪 生成文件可以用go tool trace工具分析
import (
	"testing"
	"time"
)

func Test_test(t *testing.T) {
	ti := time.Now()

	for {
		TestCode("test")
		if time.Now().Sub(ti) > time.Duration(30*time.Second) {
			break
		}
	}
}
使用改行命令 可以生成cpu,mem的分析文件
go test -run Test_test -cpuprofile=cpu.prof -memprofile=mem.prof
go tool pprof pprof文件
如图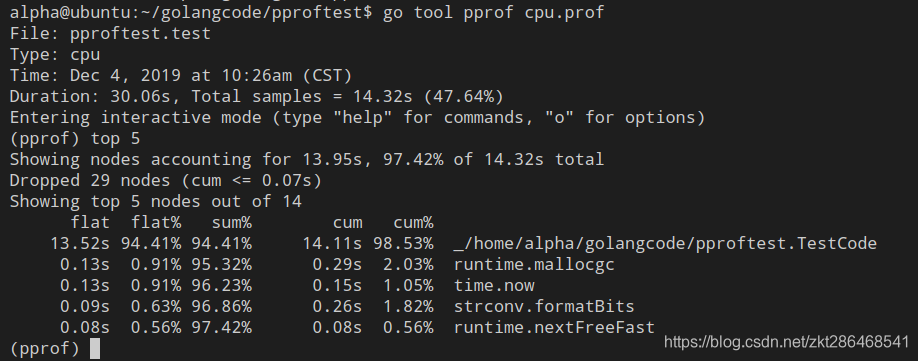
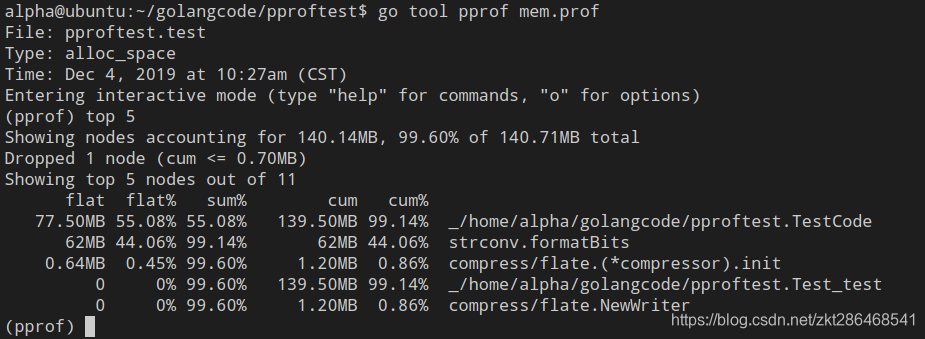
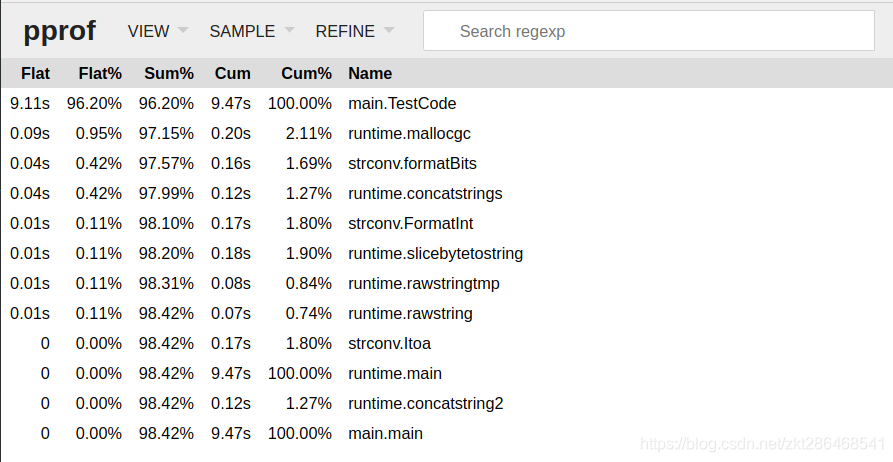
我们可以使用top命令来查看 最占用相关资源的部分
当然如果是使用的第一种监听方式 也可以实时获取信息再来分析
go tool pprof http://localhost:8090/debug/pprof/profile
go tool pprof http://localhost:8090/debug/pprof/heap
go tool pprof http://localhost:8090/debug/pprof/block
go tool pprof http://localhost:8090/debug/pprof/mutex
这些命令默认采集30秒 可在url最后添加 ?secends=10 来修改采集时间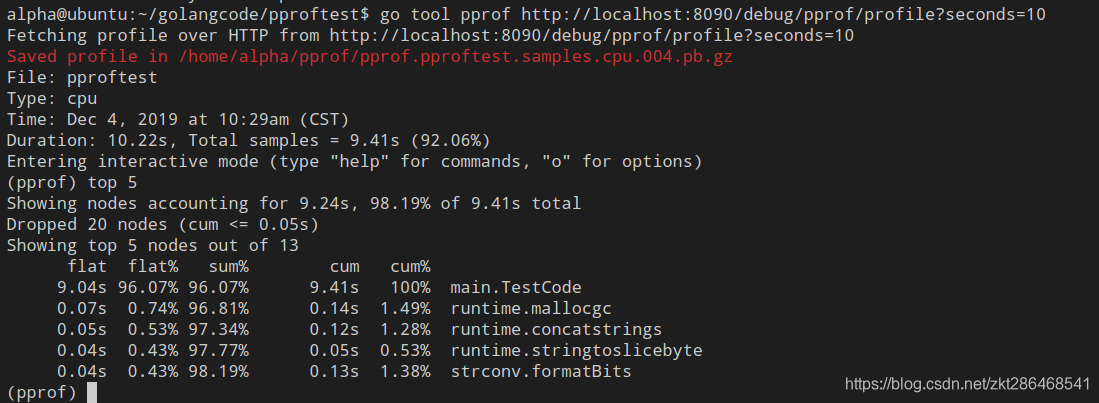
go tool pprof -http=:8000 http://localhost:8090/debug/pprof/heap
go tool pprof -http=:8000 cpu.prof
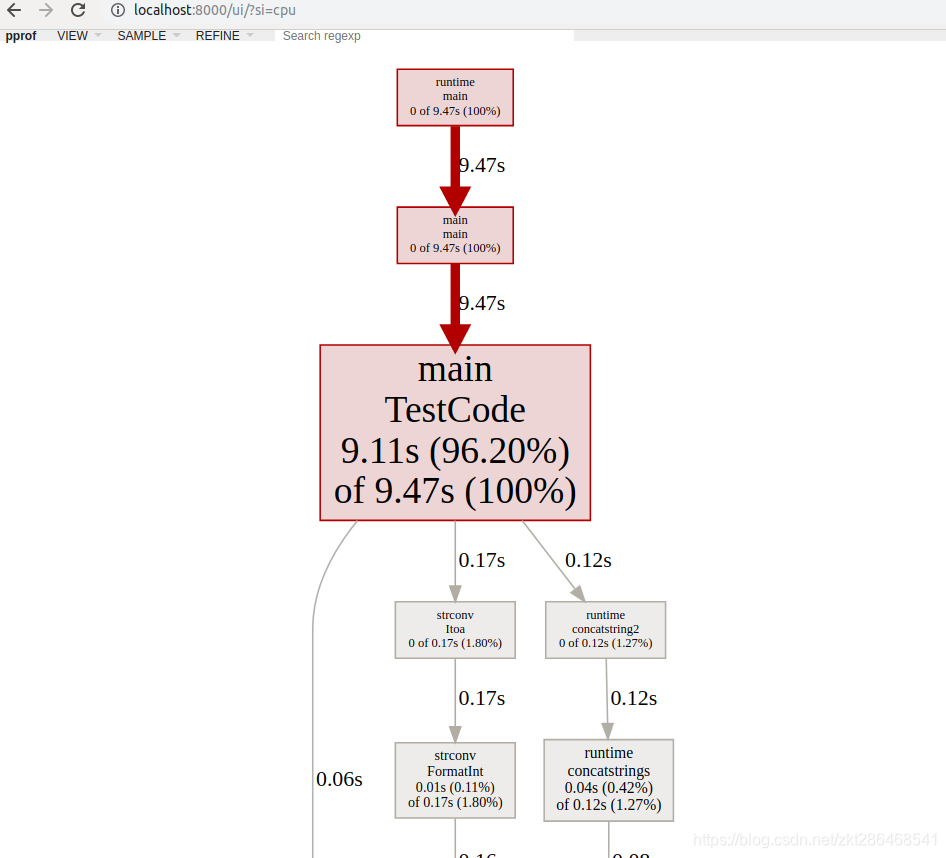
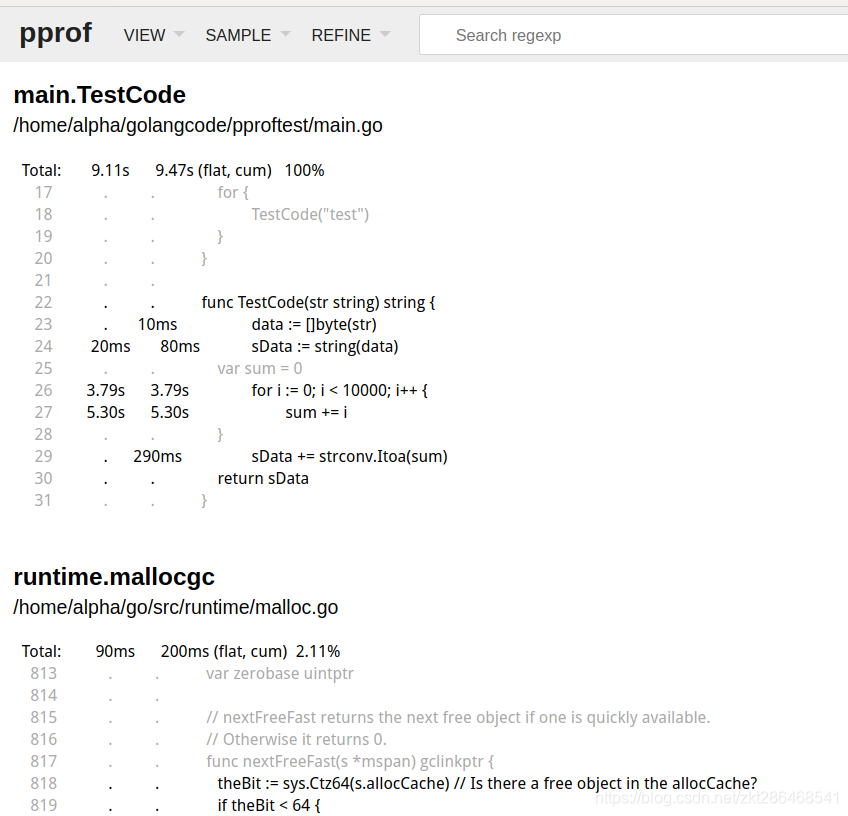
打开http://localhost:8000/ui/ 即可看到清晰的性能分析图了
这里提供了多种查看方式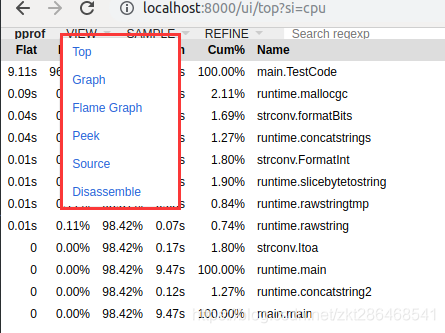
参考:https://www.jianshu.com/p/4e4ff6be6af9
https://www.cnblogs.com/chenyh555/p/11533945.html
如果觉得我的文章对您有用,请随意打赏。你的支持将鼓励我继续创作!

