社区微信群开通啦,扫一扫抢先加入社区官方微信群

社区微信群
# -*- coding: utf-8 -*-
import numpy as np
import matplotlib.pyplot as plt
from pylab import *
mpl.rcParams['font.sans-serif']=['SimHei']
def read():
	name_list = ['计算机'.decode("utf-8"),'法律'.decode("utf-8"),'文学'.decode("utf-8"),'医学'.decode("utf-8"),'体育'.decode("utf-8")]
	# name_list = ['引言','相关工作','数据','方法','实验','结果','讨论']
	time1=[0.913,0.465,0.512,0.553,0.779]
	time2=[0.072,0.465,0.268,0.415,0.162]
	time3=[0.014,0.070,0.146,0.011,0.044]
	time4=[0.000,0.000,0.073,0.021,0.015]

	location=np.arange(len(name_list))
	width=0.2

	plt.figure(figsize=(12,4))
	plt.bar(location, time1,tick_label = name_list,width = width,label="1",alpha=0.8,color="w",edgecolor="k")
	for a,b in zip(location, time1):
		plt.text(a, b+0.05, '%.3f' % b, ha='center', va= 'bottom',fontsize=7)
	plt.bar(location+width, time2,tick_label = name_list,width = width,label="1-2",alpha=0.8,color="w",edgecolor="k",hatch=".....")
	for a,b in zip(location+width, time2):
		plt.text(a, b+0.05, '%.3f' % b, ha='center', va= 'bottom',fontsize=7)
	plt.bar(location+width*2, time3,tick_label = name_list,width = width,label="2-3",alpha=0.8,color="w",edgecolor="k",hatch="/////")
	for a,b in zip(location+width*2, time3):
		plt.text(a, b+0.05, '%.3f' % b, ha='center', va= 'bottom',fontsize=7)
	plt.bar(location+width*3, time4,tick_label = name_list,width = width,label=">3",alpha=0.8,color="w",edgecolor="k",hatch="\\\\\")
	for a,b in zip(location+width*3, time4):
		plt.text(a, b+0.05, '%.3f' % b, ha='center', va= 'bottom',fontsize=7)

	plt.ylim(0,1)
	plt.legend(loc=1)
	plt.show()

if __name__ == '__main__':
	read()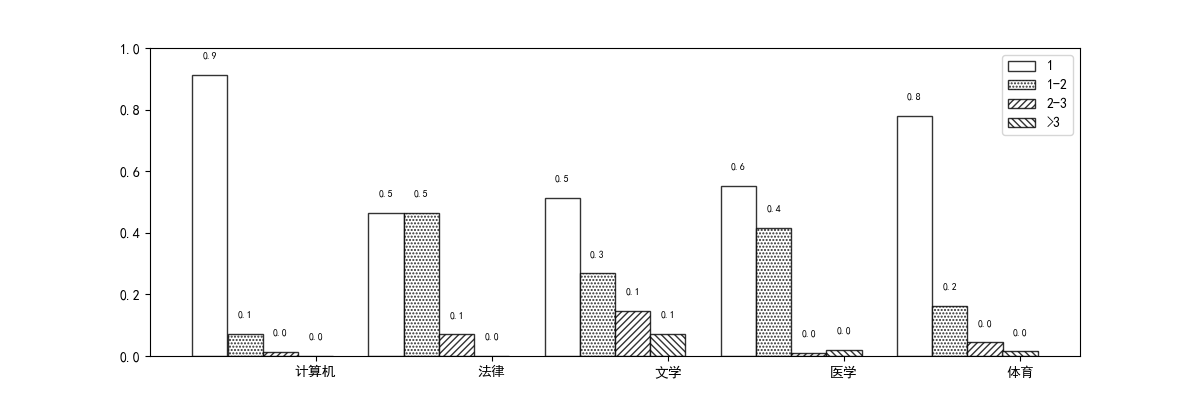

如果觉得我的文章对您有用,请随意打赏。你的支持将鼓励我继续创作!
