社区微信群开通啦,扫一扫抢先加入社区官方微信群

社区微信群
插件地址: dagre-d3
引用的资源:
d3.v3.min.js http://d3js.org/d3.v3.min.js
dagre-d3.min.js http://cpettitt.github.io/project/dagre-d3/v0.3.0/dagre-d3.min.js
html文件:
<!DOCTYPE html>
<html>
    <head>
        <meta charset="utf-8" />
        <link rel="stylesheet" href="/stylesheets/style.css" />
        <title>workflow-view</title>
    <head>
    <body>
        <svg width=960 height=600><g/></svg>
    <body>
    <script src="/javascripts/plu/jquery.min.js"></script>
    <script src="/javascripts/plu/d3.v3.min.js"></script>
    <script src="/javascripts/plu/dagre-d3.min.js"></script>
    <script src="/javascripts/workflow.js"></script>
<html>
workflow.js
// Create a new directed graph
var g = new dagreD3.graphlib.Graph().setGraph({});
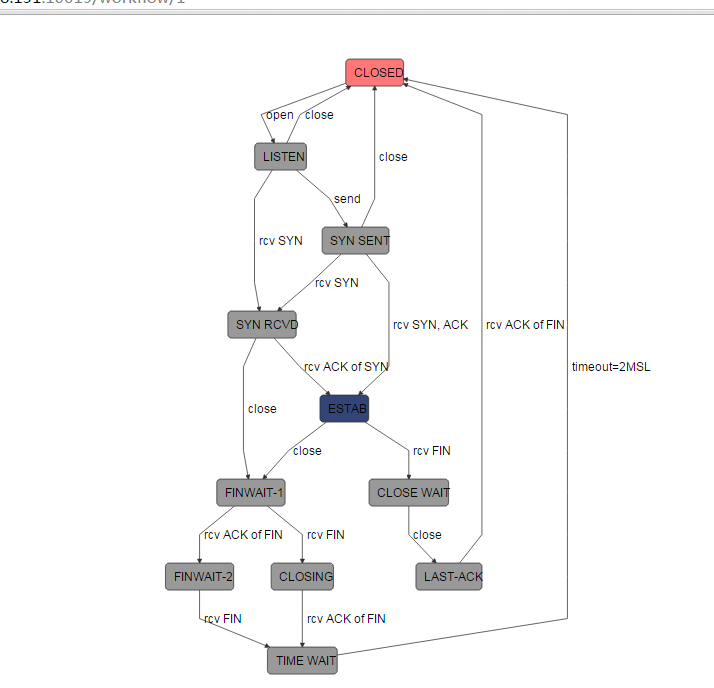
// States and transitions from RFC 793
var states = [ "CLOSED", "LISTEN", "SYN RCVD", "SYN SENT",
"ESTAB", "FINWAIT-1", "CLOSE WAIT", "FINWAIT-2",
"CLOSING", "LAST-ACK", "TIME WAIT" ];
// Automatically label each of the nodes
states.forEach(function(state) { g.setNode(state, { label: state }); });
// Set up the edges
g.setEdge("CLOSED", "LISTEN", { label: "open" });
g.setEdge("LISTEN", "SYN RCVD", { label: "rcv SYN" });
g.setEdge("LISTEN", "SYN SENT", { label: "send" });
g.setEdge("LISTEN", "CLOSED", { label: "close" });
g.setEdge("SYN RCVD", "FINWAIT-1", { label: "close" });
g.setEdge("SYN RCVD", "ESTAB", { label: "rcv ACK of SYN" });
g.setEdge("SYN SENT", "SYN RCVD", { label: "rcv SYN" });
g.setEdge("SYN SENT", "ESTAB", { label: "rcv SYN, ACK" });
g.setEdge("SYN SENT", "CLOSED", { label: "close" });
g.setEdge("ESTAB", "FINWAIT-1", { label: "close" });
g.setEdge("ESTAB", "CLOSE WAIT", { label: "rcv FIN" });
g.setEdge("FINWAIT-1", "FINWAIT-2", { label: "rcv ACK of FIN" });
g.setEdge("FINWAIT-1", "CLOSING", { label: "rcv FIN" });
g.setEdge("CLOSE WAIT", "LAST-ACK", { label: "close" });
g.setEdge("FINWAIT-2", "TIME WAIT", { label: "rcv FIN" });
g.setEdge("CLOSING", "TIME WAIT", { label: "rcv ACK of FIN" });
g.setEdge("LAST-ACK", "CLOSED", { label: "rcv ACK of FIN" });
g.setEdge("TIME WAIT", "CLOSED", { label: "timeout=2MSL" });
// Set some general styles
g.nodes().forEach(function(v) {
var node = g.node(v);
node.rx = node.ry = 5;
});
// Add some custom colors based on state
g.node('CLOSED').style = "fill: #f77";
g.node('ESTAB').style = "fill: #347";
var svg = d3.select("svg"),
inner = svg.select("g");
// Set up zoom support
var zoom = d3.behavior.zoom().on("zoom", function() {
inner.attr("transform", "translate(" + d3.event.translate + ")" +
"scale(" + d3.event.scale + ")");
});
svg.call(zoom);
// Create the renderer
var render = new dagreD3.render();
// Run the renderer. This is what draws the final graph.
render(inner, g);
// Center the graph
var initialScale = 0.75;
zoom
.translate([(svg.attr("width") - g.graph().width * initialScale) / 2, 20])
.scale(initialScale)
.event(svg);
svg.attr('height', g.graph().height * initialScale + 40);
css文件:
body {
    font: 300 14px 'Helvetica Neue',
    Helvetica;
}

.node rect {
    stroke: #333;
          fill: #999;
}

.edgePath path {
    stroke: #333;
              fill: #333;
    stroke - width: 1.5px;
}
效果
html:
<!DOCTYPE html>
<html>
    <head>
        <meta charset="utf-8" />
        <link rel="stylesheet" href="/stylesheets/style.css" />
        <title>workflow-view</title>
    <head>
    <body>
        <svg width=960 height=600><g/></svg>
    <body>
    <script src="/javascripts/plu/jquery.min.js"></script>
    <script src="/javascripts/plu/d3.v3.min.js"></script>
    <script src="/javascripts/plu/dagre-d3.min.js"></script>
    <script src="/javascripts/workflow.js"></script>
<html>
workflow.js
var g = new dagreD3.graphlib.Graph()
.setGraph({})
.setDefaultEdgeLabel(function() { return {}; });
// Here we"re setting nodeclass, which is used by our custom drawNodes function
// below.
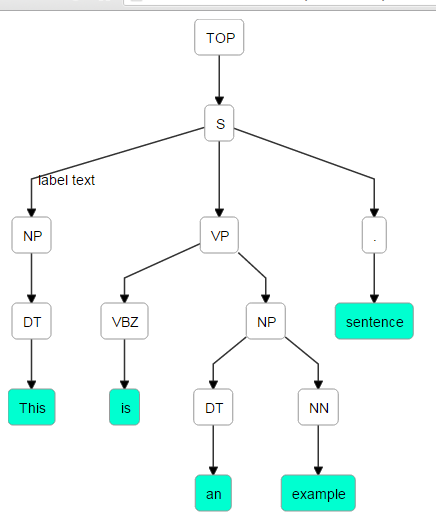
g.setNode(0, { label: "TOP", class: "type-TOP" });
g.setNode(1, { label: "S", class: "type-S" });
g.setNode(2, { label: "NP", class: "type-NP" });
g.setNode(3, { label: "DT", class: "type-DT" });
g.setNode(4, { label: "This", class: "type-TK" });
g.setNode(5, { label: "VP", class: "type-VP" });
g.setNode(6, { label: "VBZ", class: "type-VBZ" });
g.setNode(7, { label: "is", class: "type-TK" });
g.setNode(8, { label: "NP", class: "type-NP" });
g.setNode(9, { label: "DT", class: "type-DT" });
g.setNode(10, { label: "an", class: "type-TK" });
g.setNode(11, { label: "NN", class: "type-NN" });
g.setNode(12, { label: "example", class: "type-TK" });
g.setNode(13, { label: ".", class: "type-." });
g.setNode(14, { label: "sentence", class: "type-TK" });
g.nodes().forEach(function(v) {
var node = g.node(v);
// Round the corners of the nodes
node.rx = node.ry = 5;
});
// Set up edges, no special attributes.
g.setEdge(3, 4);
g.setEdge(2, 3);
g.setEdge(1, 2, {label: 'label text'});
g.setEdge(6, 7);
g.setEdge(5, 6);
g.setEdge(9, 10);
g.setEdge(8, 9);
g.setEdge(11,12);
g.setEdge(8, 11);
g.setEdge(5, 8);
g.setEdge(1, 5);
g.setEdge(13,14);
g.setEdge(1, 13);
g.setEdge(0, 1)
// Create the renderer
var render = new dagreD3.render();
// Set up an SVG group so that we can translate the final graph.
var svg = d3.select("svg"),
svgGroup = svg.append("g");
// Run the renderer. This is what draws the final graph.
render(d3.select("svg g"), g);
// Center the graph
var xCenterOffset = (svg.attr("width") - g.graph().width) / 2;
svgGroup.attr("transform", "translate(" + xCenterOffset + ", 20)");
svg.attr("height", g.graph().height + 40);
css
g.type-TK > rect {
    fill: #00ffd0;
}

text {
    font-weight: 300;
    font-family: "Helvetica Neue", Helvetica, Arial, sans-serf;
    font-size: 14px;
}

.node rect {
    stroke: #999;
    fill: #fff;
    stroke - width: 1.5px;
}

.edgePath path {
    stroke: #333;
    stroke-width: 1.5px;
}
效果:
如果觉得我的文章对您有用,请随意打赏。你的支持将鼓励我继续创作!